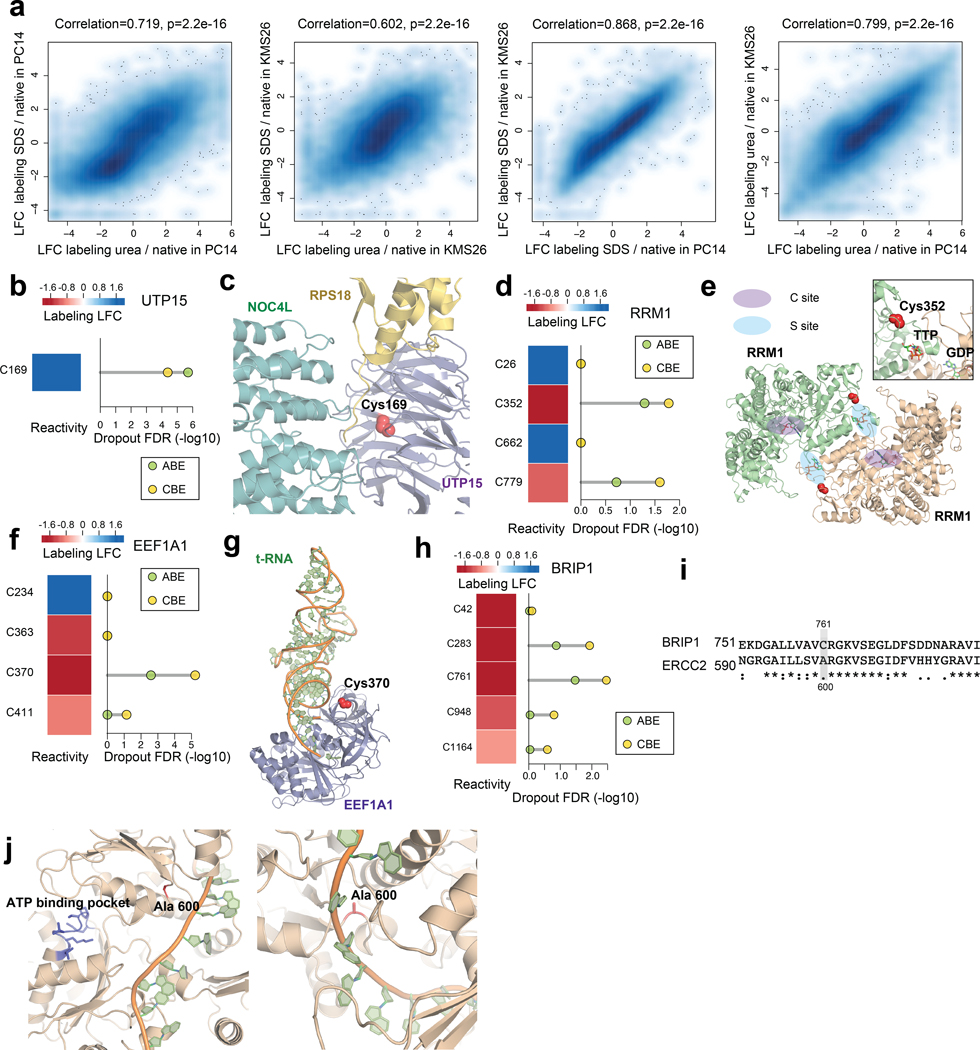
Extended Data Fig. 5 |. Prioritizing essential cysteines with ligandability potential by quantitative cysteine reactivity profiling in native and denatured proteomes.
a, (from left to right) Density scatter plots comparing the effect of i) denaturants urea vs SDS on IA-DTB labeling in PC14 cells (left) and KMS26 cells (left middle); and ii) SDS (right middle) or urea (right) on IA-DTB labeling in PC14 vs KMS26 cells. Each point represents a quantified IA-DTB labeled cysteine. Pearson correlations and associated two-sided P values were calculated based on data from 2 biologically independent samples. b, The reactivity in denatured/native proteomes (left) and significance of dropout (right) for cysteines in UTP15. c, Structure of UTP15 in complex with NOC4L and RPS18 as part of the human small subunit processome (PDB: 7MQ8). The side chain of essential, unreactive (buried) C169 is highlighted in red. d, The reactivity in denatured/native proteomes (left) and significance of dropout (right) for cysteines in RRM1. e, Structure of RRM1 bound to effector metabolite TTP at the specificity site (S site) and substrate GDP at the catalytic site (C site) (PDB: 3HND). f, The reactivity in denatured/native proteomes (left) and significance of dropout (right) for cysteines in EEF1A1. g, Structure of EEF1A1 in complex with tRNA as part of the human ribosome complex (PDB: 6ZMO). h, The reactivity in denatured/native proteomes (left) and significance of dropout (right) for cysteines in BRIP1. i, Alignment of BRIP1 and ERCC2 protein sequences. j, BRIP1 homology model based on the crystal structure of ERCC2 in complex with DNA (PDB: 6RO4). The BRIP1_C761 corresponding residue ERCC2_A600 and the ATP-binding pocket is highlighted. For b, d, f, h, the ABPP data of native versus denatured proteomes represent average values from 6 independent experiments. For b, d, f, h, the one-sided p values were first estimated by randomization tests of dropout data from two independent base-editing experiments and then adjusted by Benjamini-Hochberg procedure to calculate the FDR.

