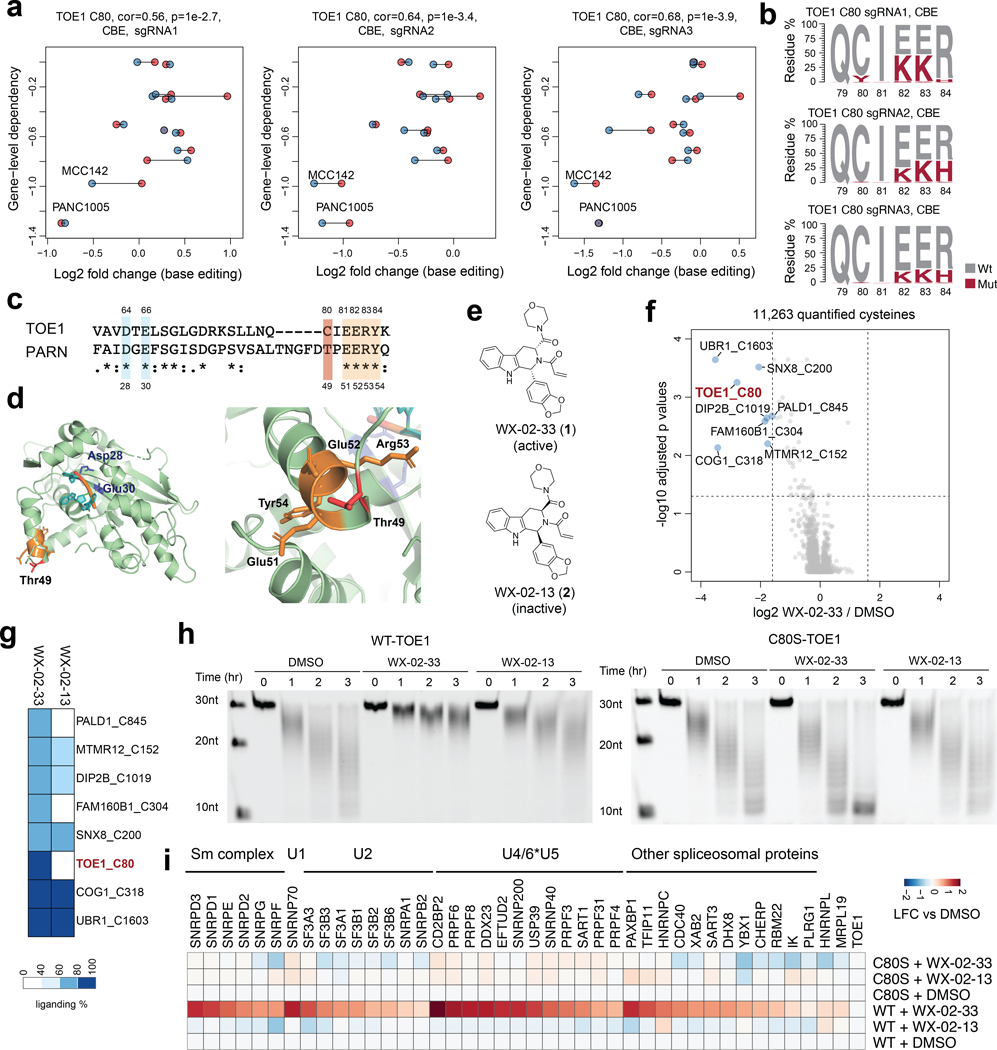
Fig. 4 |. Functional characterization of covalent ligands targeting an essential cysteine C80 in TOE1.
a, Scatter plots for the TOE1_C80 region showing the correlation between base editing dropout data acquired herein and gene disruption dropout data (DepMap). The two independent experiments are shown in blue and red. Pearson correlations and associated two-sided p values are shown. b, TOE1 amino acid mutagenesis generated by individual sgRNAs and the indicated base editors. Results are representative of two independent experiments. c, Alignment of TOE1 and PARN protein sequences. The conserved catalytic residues are highlighted in blue and the EERY sequence is highlighted in orange. d, TOE1 homology model based on the crystal structure of PARN in complex with RNA (PDB: 2A1R). PARN_T49 (corresponding to TOE1_C80) and the EERY sequence are highlighted in red and orange respectively. e, Structures of the TOE1_C80 ligand tryptoline acrylamide WX-02–33 and the less active enantiomer WX-02–13. f, Volcano plot of ABPP data showing cysteines substantially and significantly (P adjusted by Benjamini-Hochberg procedure < 0.01, two-sided Student’s t test, n = 2 independent experiments) engaged by WX-02–33 (20 μM, 3 h) in Ramos cells. g, Heatmap comparing WX-02–33 and WX-02–13 engagement for the cysteines substantially and significantly engaged by WX-02–33 identified in f. Data are average values from n = 2 independent experiments. h, Time-dependent TOE1 deadenylation activity from MCC142 cells stably expressing recombinant WT-TOE1 or a C80S-TOE1 mutant treated with WX-02–33 or WX-02–13 (20 μM, 6 h) or DMSO. The images are representative of 2 independent experiments. i, Heatmap showing proteins that were enriched in FLAG-WT- and C80S-TOE1 IP-MS experiments from stably expressing MCC142 cells treated with WX-02–33 or WX-02–13 (20 μM, 6 h) or DMSO. Displayed proteins exhibited at least 2-fold enrichment in FLAG-WT-TOE1-expressing cells compared to mock MCC142 cells. Results are average values from 2 independent experiments. Data are normalized to TOE1 signals within each experiment.

