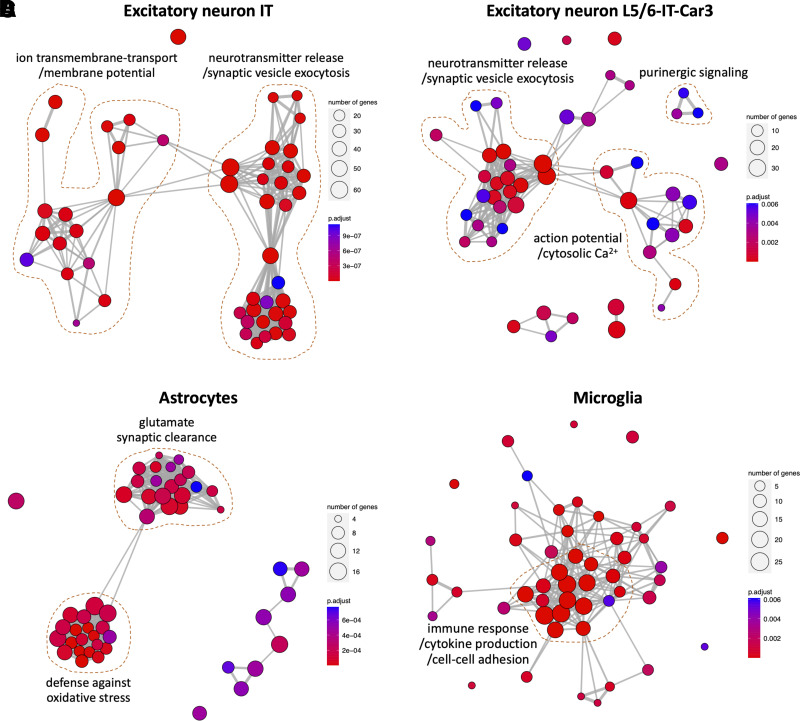
Figure 3.
Functional network enrichment analysis of genes specific to cell types implicated by HbA1c–CT association: excitatory IT neurons (A), excitatory L5/6-IT-Car3 neurons (B), astrocytes (C), and microglia (D). Significant biologic processes are represented as nodes, and thickness of connecting edges represents pairwise similarity between processes. N of intersected genes for a particular process is represented by size of each node, whereas false discovery rate–corrected P value is indicated by color. IT, intra-telencephalic.

