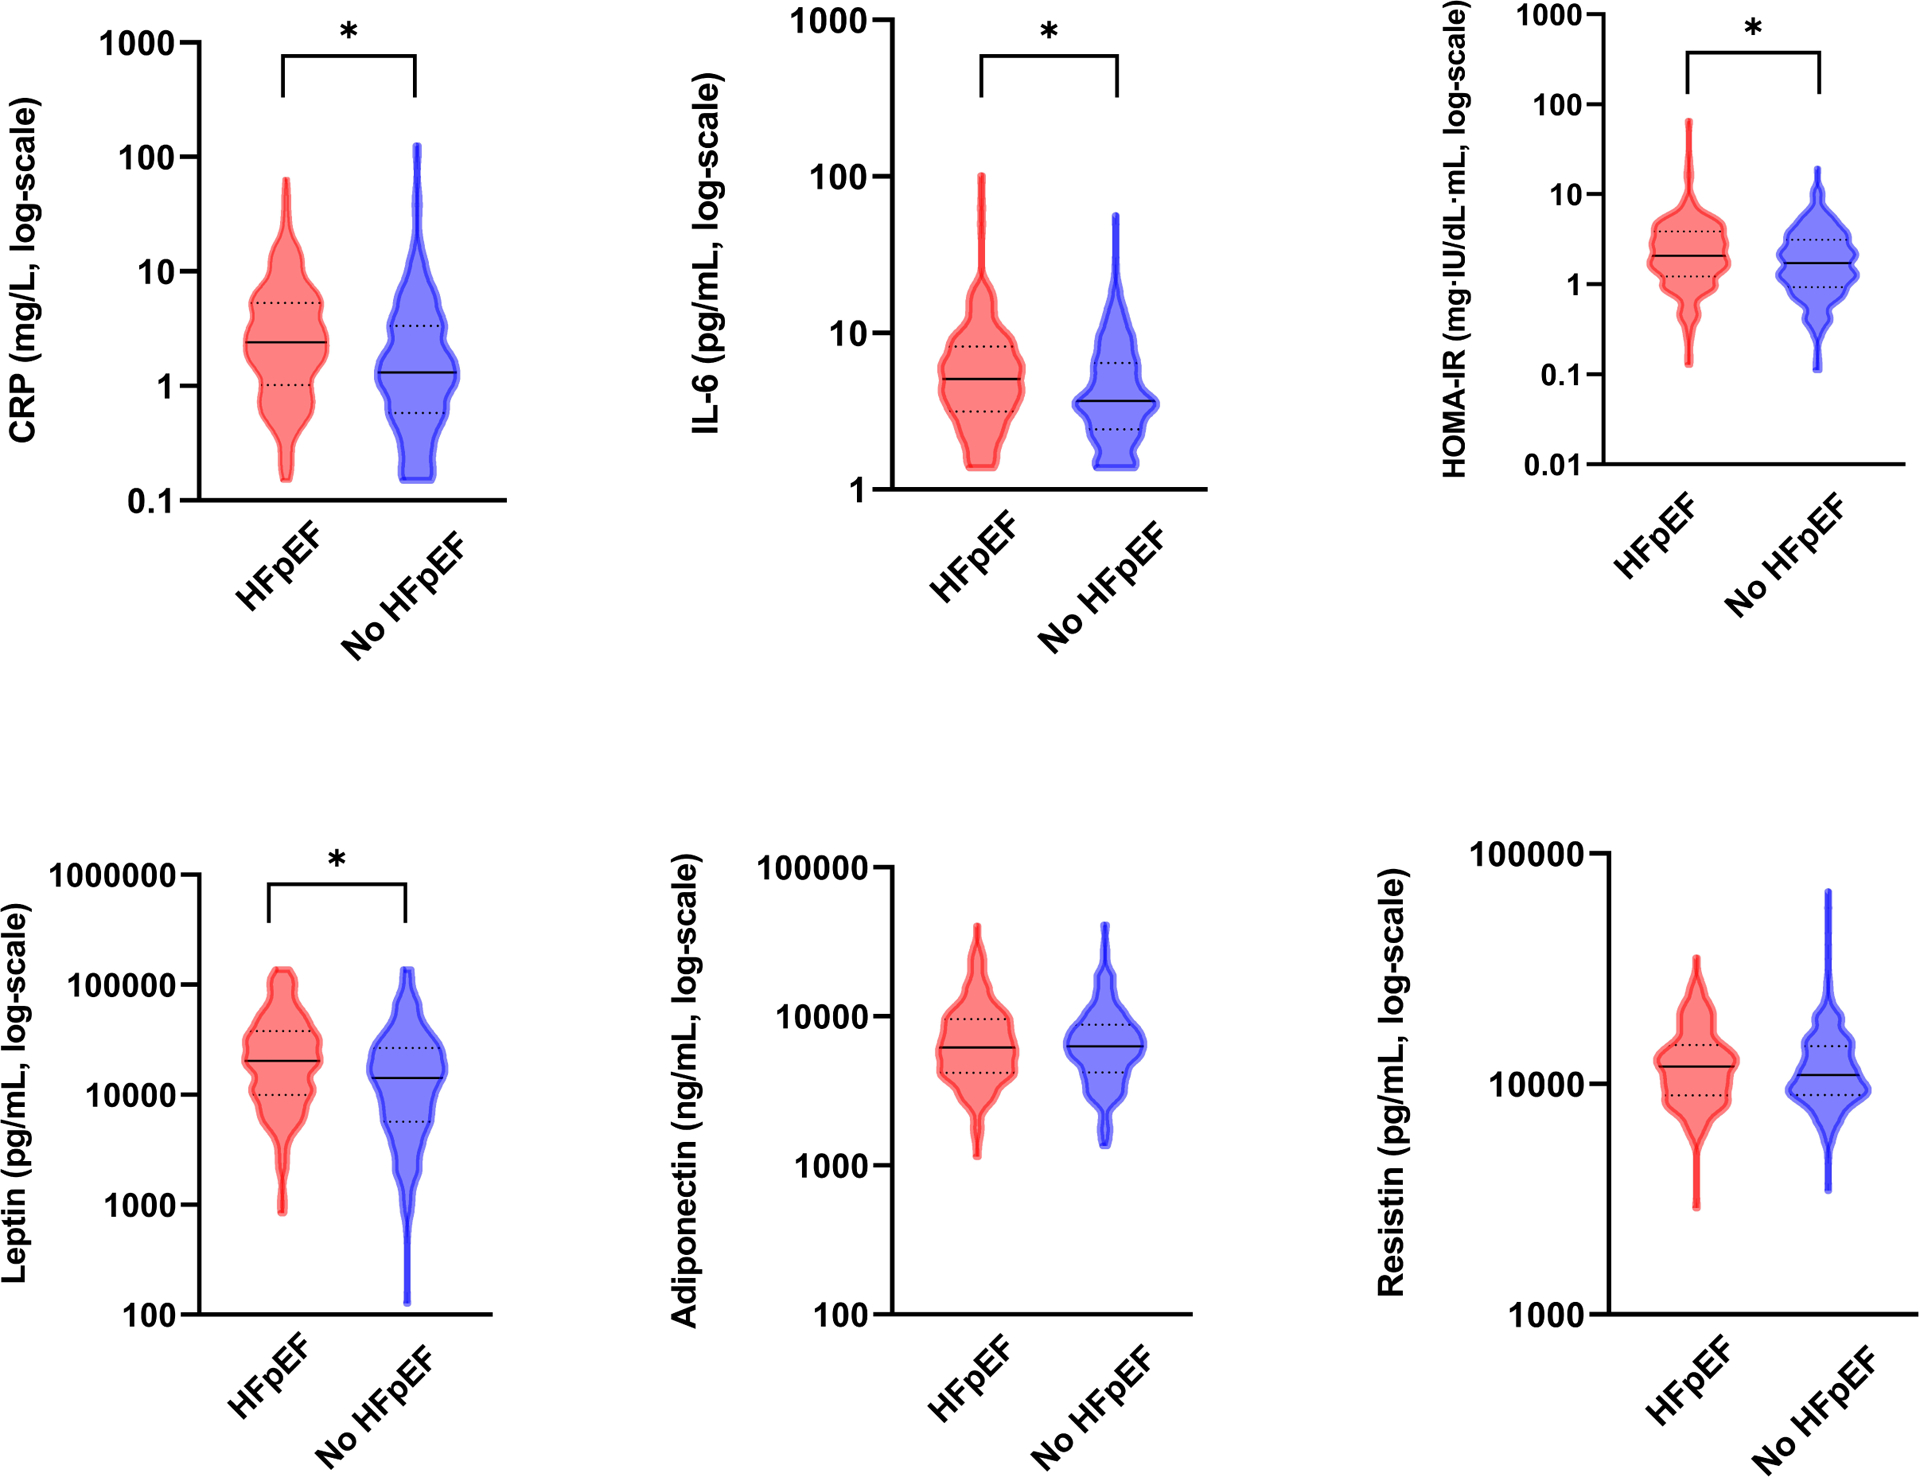
Figure 2. Differences in obesity-related biomarkers in participants with HFpEF vs. without HFpEF.

Violin plots displays between group differences in baseline values for biomarkers in participants with (red) and without HFpEF (blue). * Indicates p ≤ 0.0.5 via Mann-Whitney test. HOMA-IR levels calculated only in patients without diabetes. Lower detection limit for CRP is <0.15 mg/L and for IL-6 is <1.38 pg/mL.
