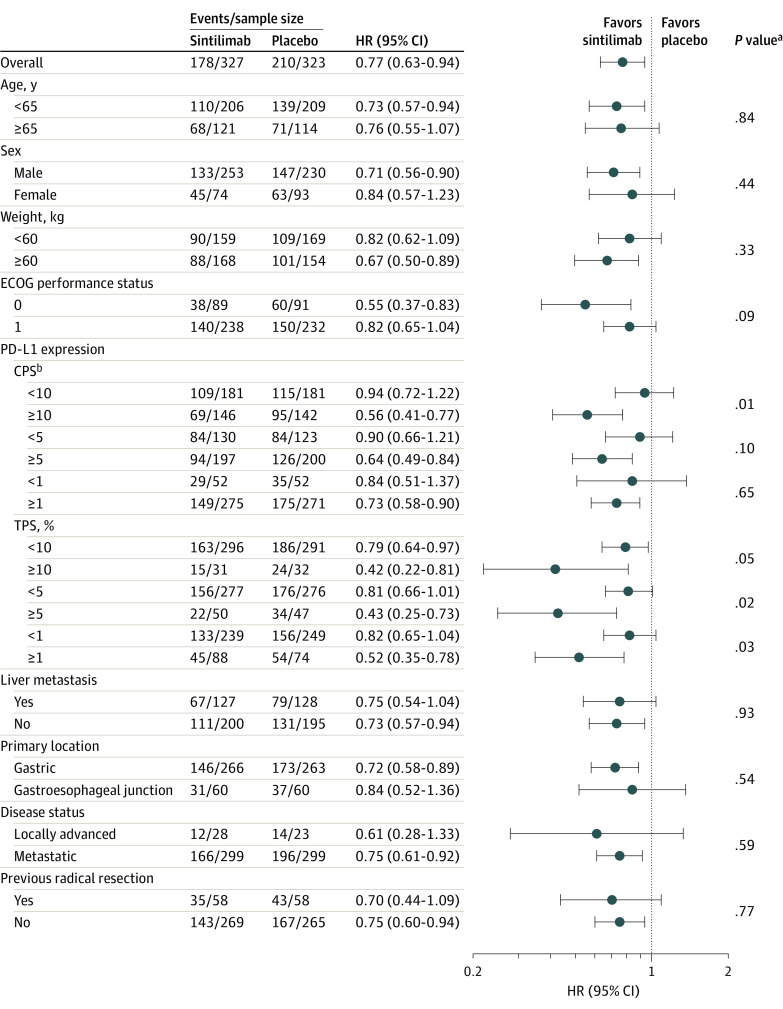
Figure 3. Subgroup Plot for Prespecified Subgroup Analyses of Overall Survival in All Randomized Patients at the Interim Efficacy Analysis.
aInteraction P values.
bSee Figure 1 legend footnote e for programmed cell death ligand 1 (PD-L1) combined positive score (CPS) calculations. A CPS of 5 or more was defined as PD-L1 positive.
ECOG indicates Eastern Cooperative Oncology Group; HR, hazard ratio; TPS, tumor proportion score.

