
Figure 2.
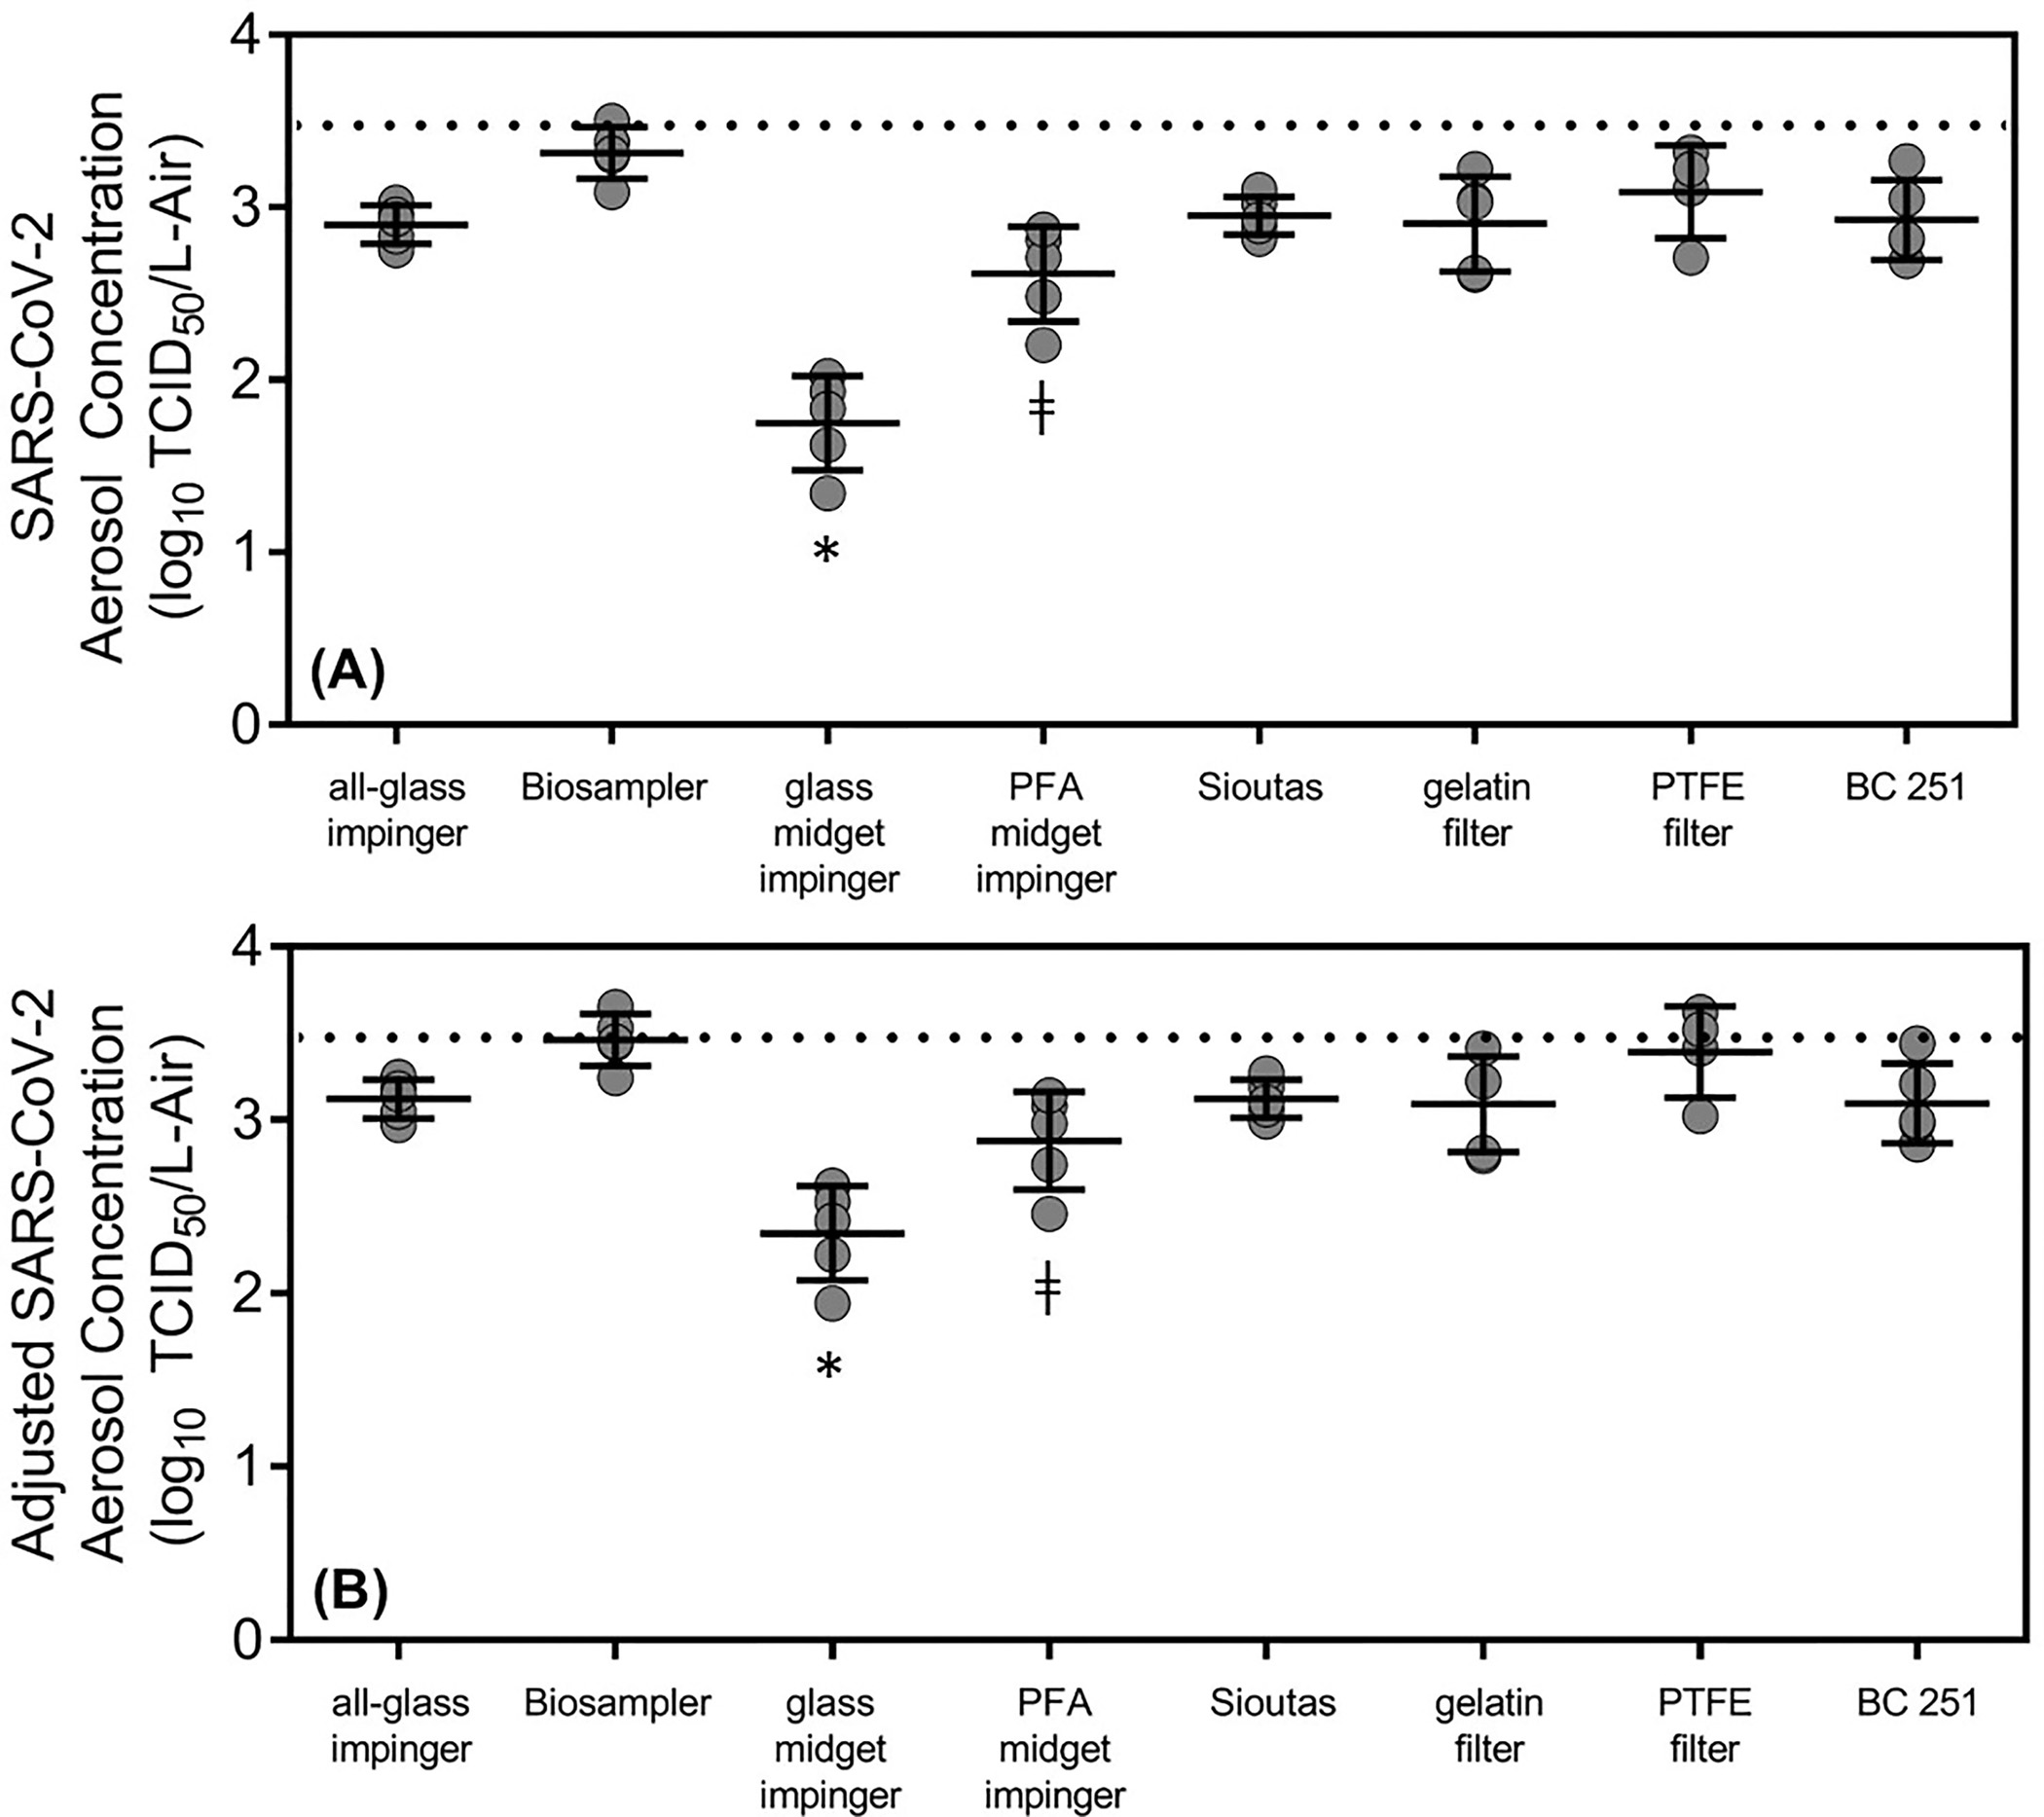
Aerosol concentrations of SARS-CoV-2 measured with each sampler during three minutes of sampling. (a) Concentrations of SARS-CoV-2 and (b) adjusted concentrations of SARS-CoV-2 when accounting for physical losses. Recovered concentrations in the glass midget impinger were significantly lower (depicted with *) than all of the other samplers, and concentrations in the PFA midget impinger were lower (depicted with ǂ) than both the Biosampler and the PTFE filter (one-way ANOVA, Tukey’s multiple comparison test, α = 0.05). The concentrations measured with the Biosampler and PTFE filter were not statistically different than the theoretical maximum (dotted line) based on the concentration of the aerosolized material, liquid feed rate, and air flow rate in the system assuming no physical losses (ordinary one-way ANOVA α = 0.05).