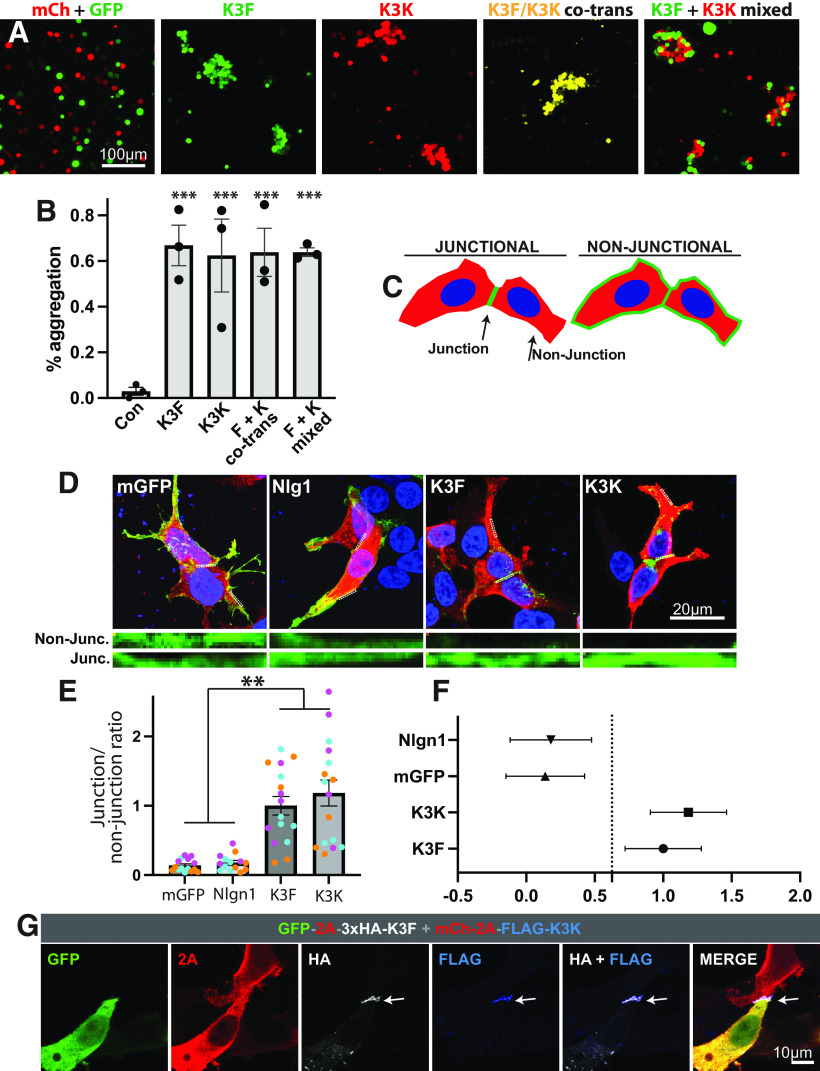
Figure 3.
Homophilic binding of Kirrel3 isoforms. A, Example of the CHO-cell aggregation assay. CHO cells are expressing mCherry (mCh) or GFP as a control, GFP-2A-Kirrel3F (K3F), mCherry-2A-Kirrel3K (K3K) or both Kirrel3 isoforms. B, Quantification of CHO cell aggregation assays. N = 3 independent trials for each condition. Error bars = SEM p = 0.003 for a one-way ANOVA and ***p < 0.001 for each pairwise post-test comparison with the control condition. C, Diagram of the cell junction assay in adherent HEK293 cells. D, Example of the cell junction assay. Note that Kirrel3F and Kirrel3K are both highly enriched in the cell-cell junction, but the control proteins, membrane bound GFP (mGFP) and Neuroligin-1 (Nlg1), are not. E, F, Quantification of the adherent cell junction assay. E, Bar graphs and error bars indicate SEM. Each dot indicates a cell and each color denotes cells from an independent culture. One-way nested ANOVA indicates p < 0.001 and **p < 0.01 from pairwise post-tests. F, Same data but graphed as a mean estimation plot with error bars showing SD, indicating that Nlg1 and mGFP are significantly different from Kirrel3F and Kirrel3K. G, Example image showing that K3F and K3K cluster heterophilically in junctions when they are expressed in different cells.

