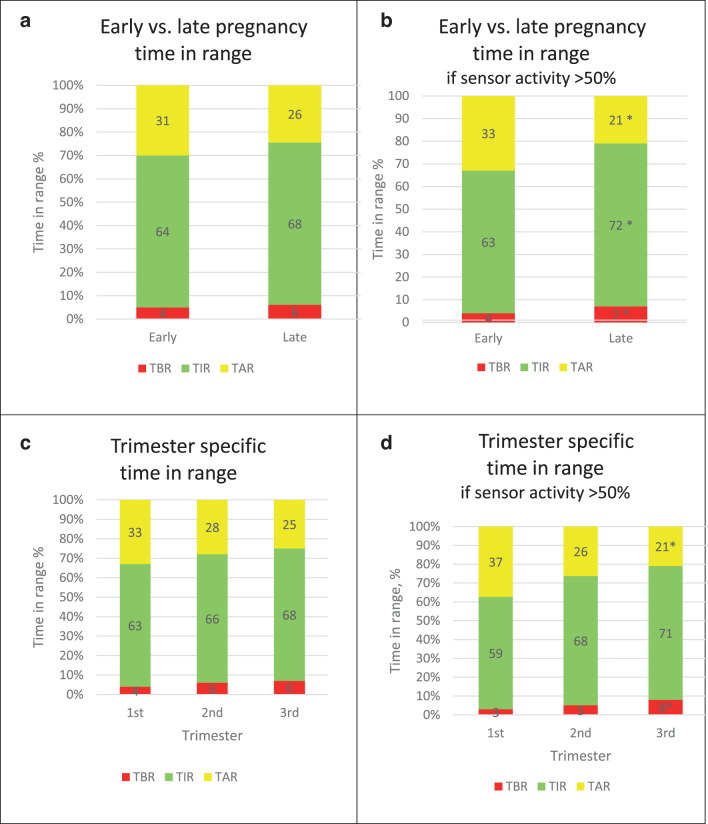
FIG. 1.
Mean percent TIR, TAR, and TBR in early versus late pregnancy and in each trimester. (a) Total cohort, n = 41, mean TIR% (SD), 64% (24) versus 68% (21), P = 0.41; TAR% (SD), 31% (26) versus 26% (22), P = 0.27; TBR% (SD), 4% (6) versus 6% (6), P = 0.25. (b) In those with sensor activity >50% in the third trimester, n = 29, mean TIR% (SD), 63% (25) versus 72% (16), P = 0.04; TAR% (SD), 33% (27) versus 21% (18), P = 0.01; TBR% (SD), 4% (4) versus 7% (7), P = 0.01. (c) First trimester n = 16, second trimester n = 32, third trimester n = 41. TIR% (SD) 63% (21), 66% (22), 68% (21), P = 0.9; TAR% (SD) 33% (24), 28% (23), 25% (22), P = 0.7 and TBR% (SD), 4% (3), 6% (8), 6% (7), P = 0.05 in each trimester, respectively. (d) First trimester n = 12, second trimester n = 23, third trimester n = 29. TIR% (SD) 59% (24), 68% (22), 71% (16), P = 0.08; TAR% (SD) 37% (25), 26% (23), 21% (17), P = 0.03; TBR% (SD) 3% (4), 5% (5), 8% (8), P = 0.04. Glucose target range defined as 3.5–7.8 mmol/L (63–140 mg/dL) and TIR, TAR, TBR expressed as a percent of all time with continuous glucose monitoring output over a 14-day period. Early pregnancy, first 2 weeks of sensor use, mean (range) gestation 16 (6–28) weeks. Late pregnancy, last 2 weeks of sensor use, mean (range) gestation 35 (28–38) weeks. SD, standard deviation; TAR, time above range; TBR, time below range; TIR, time in range.

