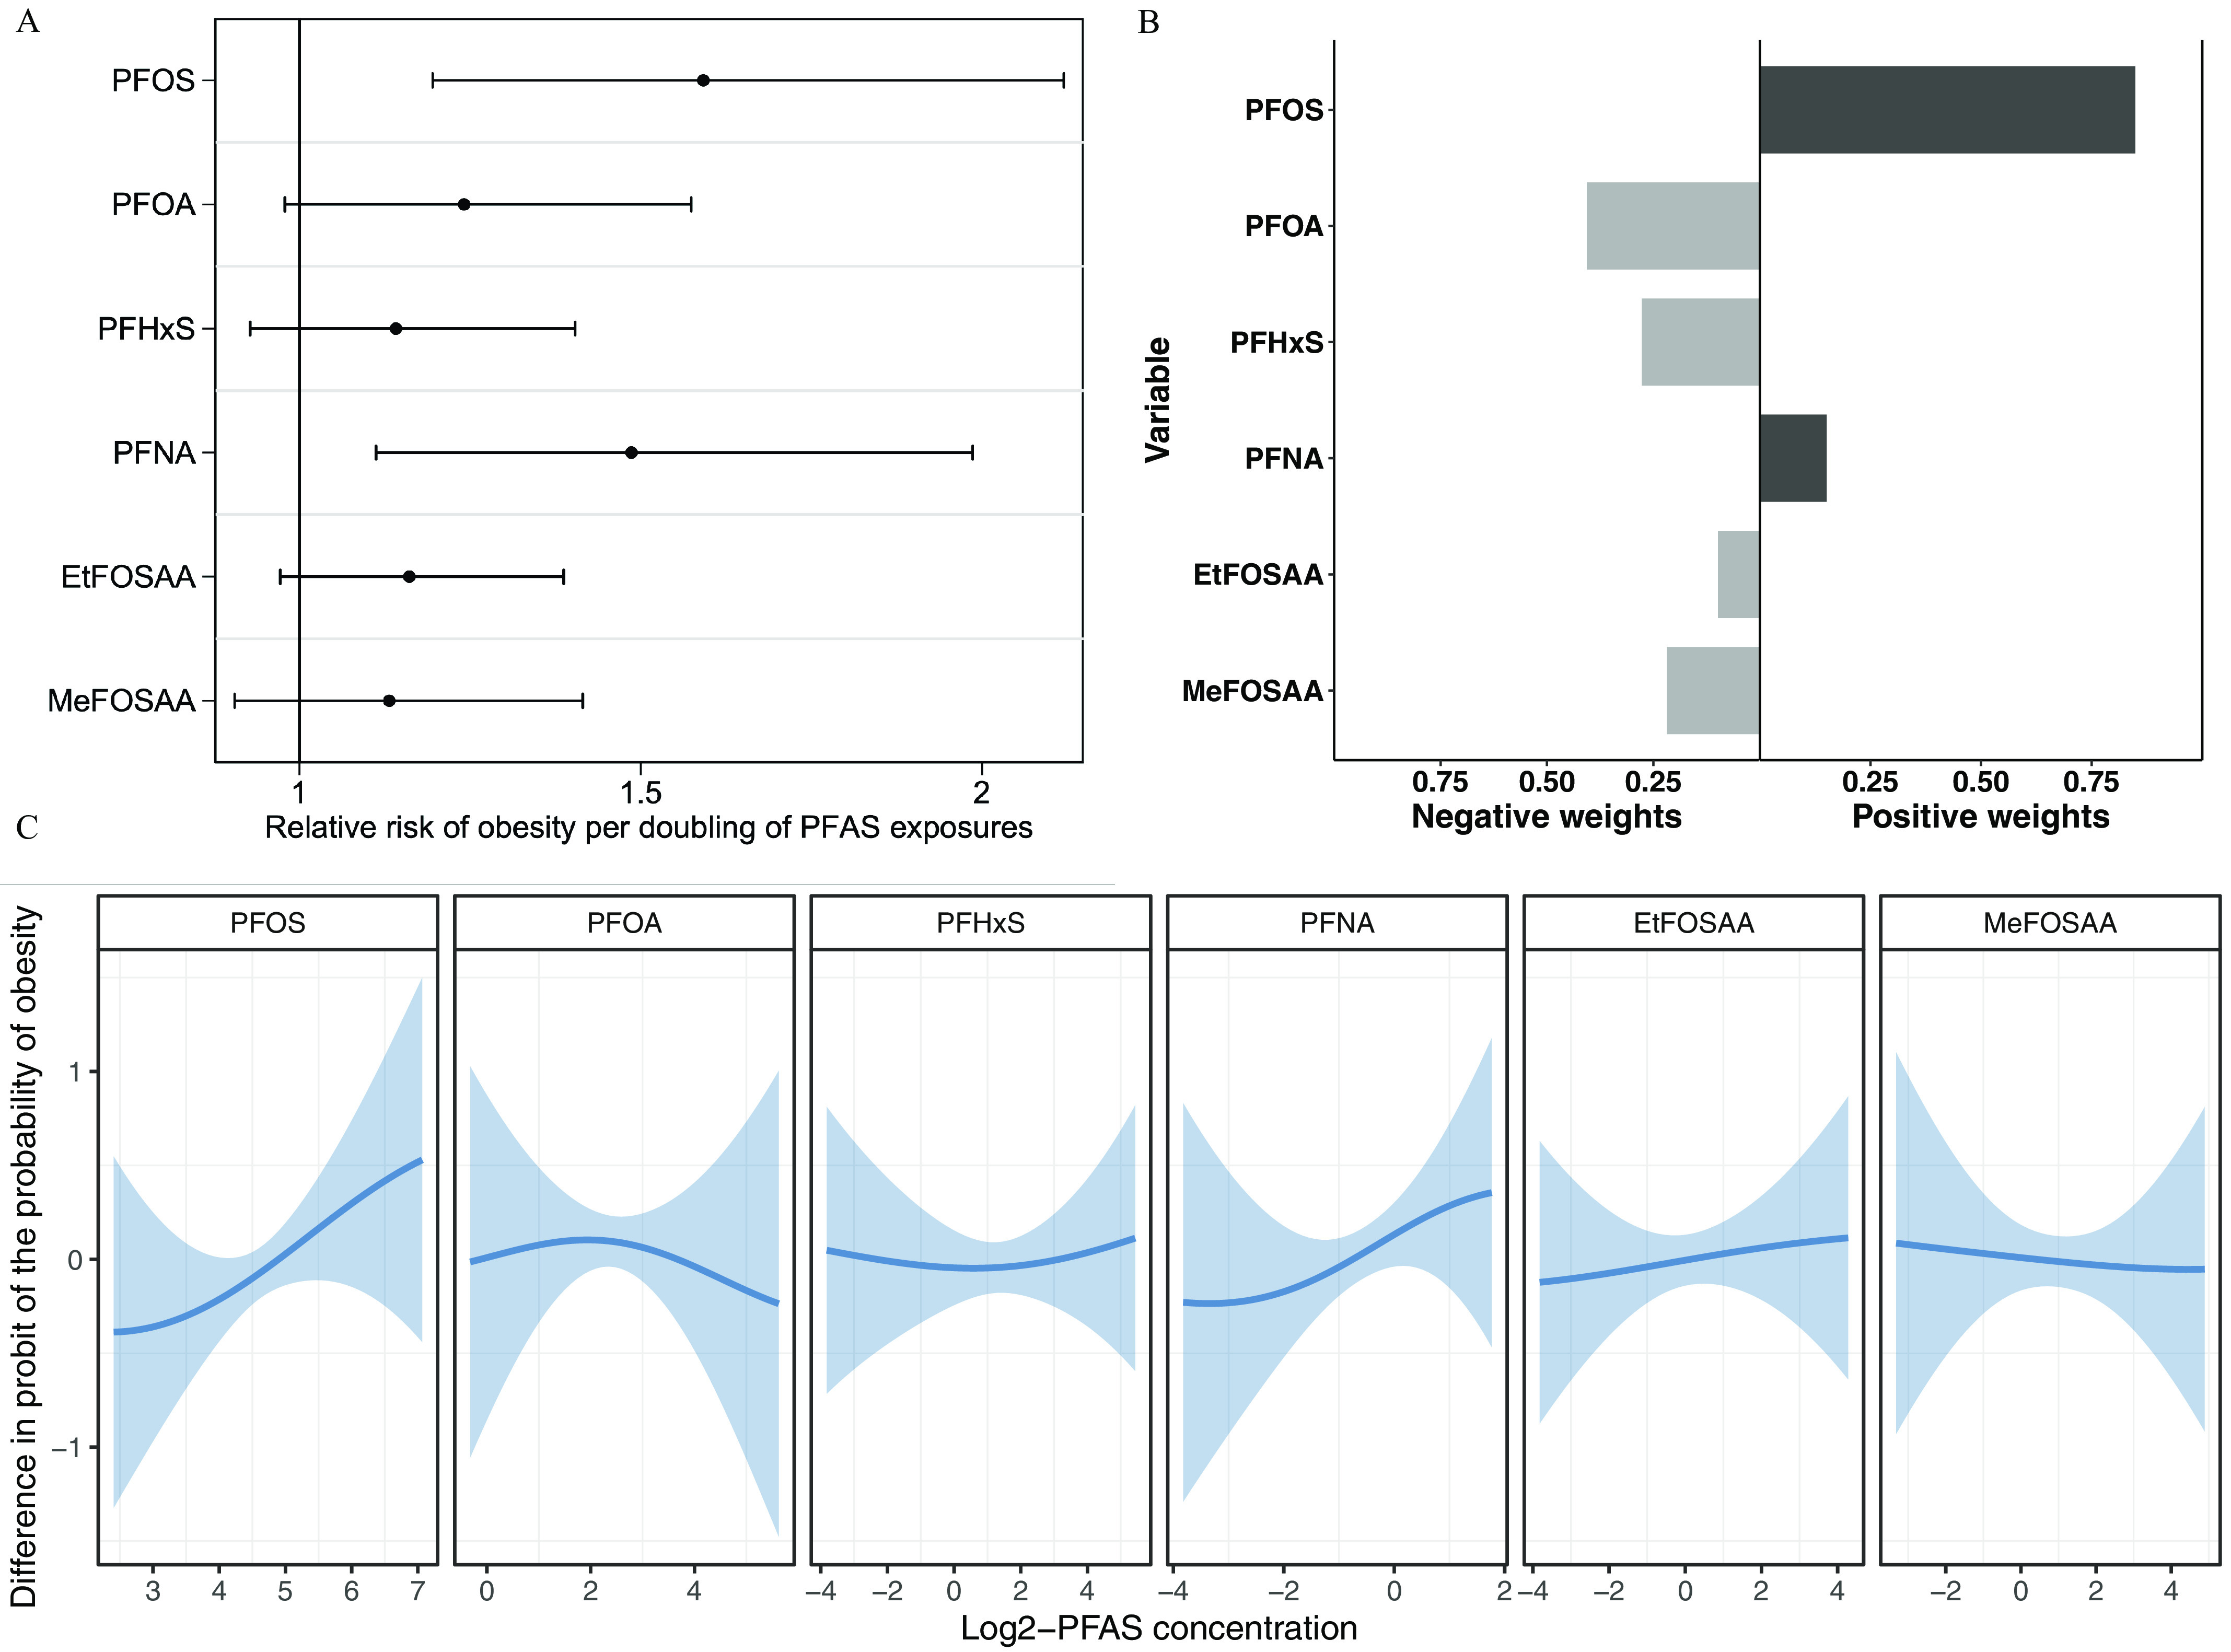
Figure 2.

Multivariable-adjusted associations between individual prenatal PFAS and obesity in late adolescence estimated using (A) Poisson regression with robust variance estimates, (B) quantile g-computation, and (C) Bayesian kernel machine regression (). (A) shows the relative risks and 95% confidence intervals of obesity per doubling of individual PFAS levels [estimates are provided in Table 3 (adjusted)]. (B) shows the weights for each PFAS that correspond to the proportion of the overall effect of all PFAS on obesity in the positive or negative direction (positive and negative weights, respectively, add up to 1, representing the proportion of the overall effect and the relative importance of each mixture component within each direction; the shading of bars represents the overall effect size within each direction, with darker shades indicating a larger effect compared with lighter shades; estimates are provided in Table S8). (C) shows the estimates and 95% credible intervals of PFAS with obesity risk when all other PFAS are fixed at their 50th percentile (percentile values for -transformed PFAS levels are provided in Table S2). Obesity was defined as percentile for age and sex based on the Centers for Disease Control and Prevention Growth Charts (reference is percentile). Participants were from the Project Viva prebirth cohort. Pregnant women were enrolled between April 1999 and July 2002, and the late adolescence visit was conducted between July 2017 and September 2021. Models were adjusted for maternal age at enrollment, race and ethnicity, prepregnancy BMI, educational level, marital status, parity, and pregnancy smoking status. Note: BMI, body mass index; EtFOSAA, 2-(-ethyl-perfluorooctane sulfonamido) acetate; MeFOSAA, 2-(-methyl-perfluorooctane sulfonamido) acetate; PFAS, per- and polyfluoroalkyl substances; PFHxS, perfluorohexane sulfonate; PFNA, perfluorononanoate; PFOA, perfluorooctanoate; PFOS, perfluorooctane sulfonate.
