. 2023 Dec 6;131(12):127002. doi: 10.1289/EHP12597

Figure 4.

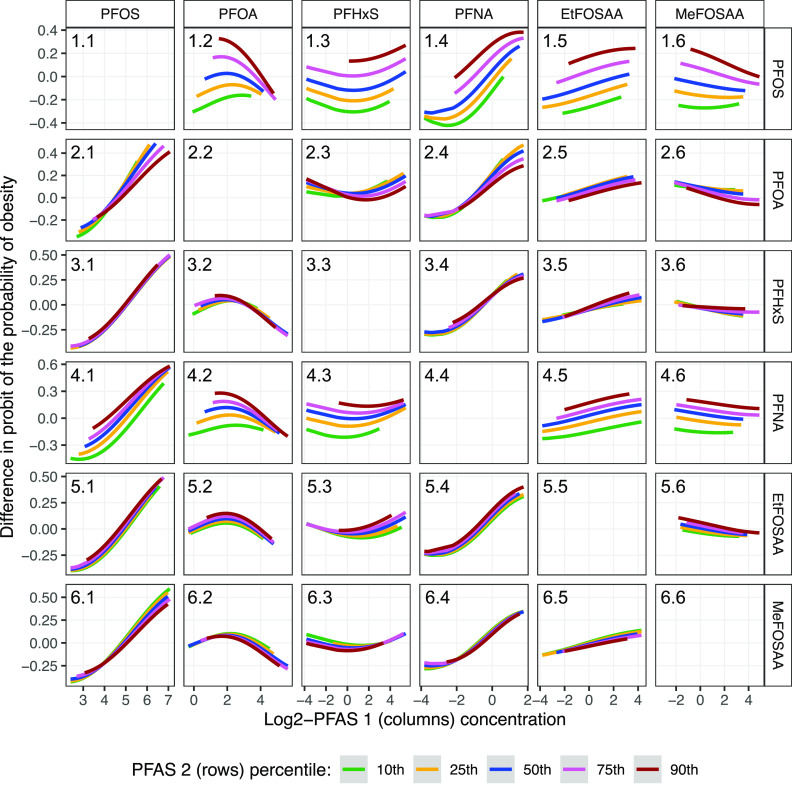
Figure 4 is a set of thirty-six line graphs. On the first row, the six graphs are titled perfluorooctane sulfonate, perfluorooctanoate, perfluorohexane sulfonate, perfluorononanoate, 2-(N-ethyl-perfluorooctane sulfonamido) acetate, and 2-(N-methyl-perfluorooctane sulfonamido) acetate, plotting Difference in probit of the probability of obesity, ranging from negative 0.4 to 0.4 in increments of 0.2 (left y-axis) and perfluorooctane sulfonate (right y-axis) across log 2-2− per- and polyfluoroalkyl substances 1 (columns) concentration, ranging from 3 to 7 in unit increments, 0 to 4 in increments of 2, negative 4 to 4 in increments of 2, negative 4 to 2 in increments of 2, negative 4 to 4 in increments of 2, and negative 2 to 4 in increments of 2 (x-axis) for 2− per- and polyfluoroalkyl substances 2 (rows) percentile, ranging as tenth, twenty-fifth, fiftieth, seventy-fifth, and ninetieth, respectively. On the second row, the six graphs are titled perfluorooctane sulfonate, perfluorooctanoate, perfluorohexane sulfonate, perfluorononanoate, 2-(N-ethyl-perfluorooctane sulfonamido) acetate, and 2-(N-methyl-perfluorooctane sulfonamido) acetate, plotting Difference in probit of the probability of obesity, ranging from negative 0.2 to 0.4 in increments of 0.2 (left y-axis) and perfluorooctanoate (right y-axis) across log 2-2− per- and polyfluoroalkyl substances 1 (columns) concentration, ranging from 3 to 7 in unit increments, 0 to 4 in increments of 2, negative 4 to 4 in increments of 2, negative 4 to 2 in increments of 2, negative 4 to 4 in increments of 2, and negative 2 to 4 in increments of 2 (x-axis) for 2− per- and polyfluoroalkyl substances 2 (rows) percentile, ranging as tenth, twenty-fifth, fiftieth, seventy-fifth, and ninetieth, respectively. On the third row, the six graphs are titled perfluorooctane sulfonate, perfluorooctanoate, perfluorohexane sulfonate, perfluorononanoate, 2-(N-ethyl-perfluorooctane sulfonamido) acetate, and 2-(N-methyl-perfluorooctane sulfonamido) acetate, plotting Difference in probit of the probability of obesity, ranging from negative 0.25 to 0.50 in increments of 0.25 (left y-axis) and perfluorohexane sulfonate (right y-axis) across log 2-2− per- and polyfluoroalkyl substances 1 (columns) concentration, ranging from 3 to 7 in unit increments, 0 to 4 in increments of 2, negative 4 to 4 in increments of 2, negative 4 to 2 in increments of 2, negative 4 to 4 in increments of 2, and negative 2 to 4 in increments of 2 (x-axis) for 2− per- and polyfluoroalkyl substances 2 (rows) percentile, ranging as tenth, twenty-fifth, fiftieth, seventy-fifth, and ninetieth, respectively. On the forth row, the six graphs are titled perfluorooctane sulfonate, perfluorooctanoate, perfluorohexane sulfonate, perfluorononanoate, 2-(N-ethyl-perfluorooctane sulfonamido) acetate, and 2-(N-methyl-perfluorooctane sulfonamido) acetate, plotting Difference in probit of the probability of obesity, ranging from negative 0.3 to 0.6 in increments of 0.3 (left y-axis) and perfluorononanoate (right y-axis) across log 2-2− per- and polyfluoroalkyl substances 1 (columns) concentration, ranging from 3 to 7 in unit increments, 0 to 4 in increments of 2, negative 4 to 4 in increments of 2, negative 4 to 2 in increments of 2, negative 4 to 4 in increments of 2, and negative 2 to 4 in increments of 2 (x-axis) for 2− per- and polyfluoroalkyl substances 2 (rows) percentile, ranging as tenth, twenty-fifth, fiftieth, seventy-fifth, and ninetieth, respectively. On the fifth row, the six graphs are titled perfluorooctane sulfonate, perfluorooctanoate, perfluorohexane sulfonate, perfluorononanoate, 2-(N-ethyl-perfluorooctane sulfonamido) acetate, and 2-(N-methyl-perfluorooctane sulfonamido) acetate, plotting Difference in probit of the probability of obesity, ranging from negative 0.25 to 0.50 in increments of 0.25 (left y-axis) and 2-(N-ethyl-perfluorooctane sulfonamido) acetate (right y-axis) across log 2-2− per- and polyfluoroalkyl substances 1 (columns) concentration, ranging from 3 to 7 in unit increments, 0 to 4 in increments of 2, negative 4 to 4 in increments of 2, negative 4 to 2 in increments of 2, negative 4 to 4 in increments of 2, and negative 2 to 4 in increments of 2 (x-axis) for 2− per- and polyfluoroalkyl substances 2 (rows) percentile, ranging as tenth, twenty-fifth, fiftieth, seventy-fifth, and ninetieth, respectively. On the sixth row, the six graphs are titled perfluorooctane sulfonate, perfluorooctanoate, perfluorohexane sulfonate, perfluorononanoate, 2-(N-ethyl-perfluorooctane sulfonamido) acetate, and 2-(N-methyl-perfluorooctane sulfonamido) acetate, plotting Difference in probit of the probability of obesity, ranging from negative 0.25 to 0.50 in increments of 0.25 (left y-axis) and 2-(N-methyl-perfluorooctane sulfonamido) acetate (right y-axis) across log 2-2− per- and polyfluoroalkyl substances 1 (columns) concentration, ranging from 3 to 7 in unit increments, 0 to 4 in increments of 2, negative 4 to 4 in increments of 2, negative 4 to 2 in increments of 2, negative 4 to 4 in increments of 2, and negative 2 to 4 in increments of 2 (x-axis) for 2− per- and polyfluoroalkyl substances 2 (rows) percentile, ranging as tenth, twenty-fifth, fiftieth, seventy-fifth, and ninetieth, respectively.

Associations (estimates) between prenatal PFAS 1 concentrations (columns) and obesity risk (defined as BMI95th percentile for age and sex; reference is BMI<95th percentile) in late adolescence by levels (10th, 25th, 50th, 75th, and 90th percentiles) of prenatal PFAS 2 concentration (rows) when all other PFAS are fixed at their 50th percentile estimated using Bayesian kernel machine regression (n=545). Percentile values for log2-transformed PFAS levels are provided in Table S2. Estimates are provided in Excel Table S1. Participants were from the Project Viva prebirth cohort. Pregnant women were enrolled between April 1999 and July 2002, and the late adolescence visit was conducted between July 2017 and September 2021. Models were adjusted for maternal age at enrollment, race and ethnicity, prepregnancy BMI, educational level, marital status, parity, pregnancy smoking status. Note: BMI, body mass index; EtFOSAA, 2-(N-ethyl-perfluorooctane sulfonamido) acetate; MeFOSAA, 2-(N-methyl-perfluorooctane sulfonamido) acetate; PFAS, per- and polyfluoroalkyl substances; PFHxS, perfluorohexane sulfonate; PFNA, perfluorononanoate; PFOA, perfluorooctanoate; PFOS, perfluorooctane sulfonate.