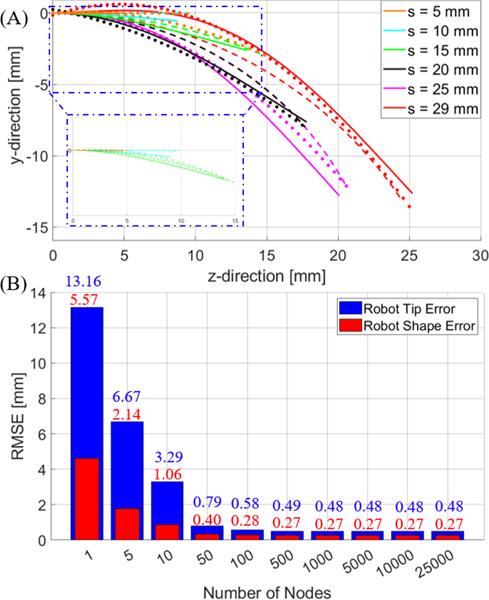
Fig. 6.
(A) depicts the tube shape for different insertion depths calculated using the model (solid line). The dots represent the image locations corresponding to the tube centerline and the dashed line represents the piece-wise constant curvature assumption evaluation for different insertion depths with tip error minimization. (B) Error bars representing the average RMSE of the robot tip (blue) and shape (red) of the model based on the number of nodes across all insertion depths tested (i.e. 1 mm to 29 mm in 1 mm increments).

