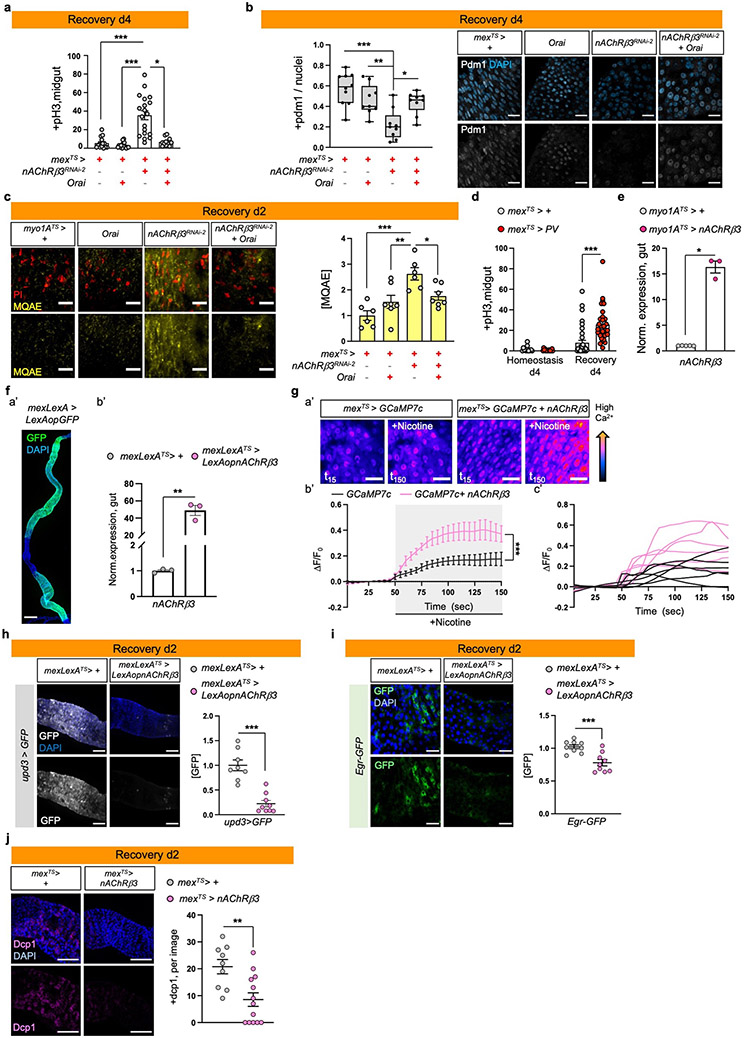
Ext. Data Fig.5 ∣. nAChRβ3-mediated Ca2 promotes recovery.
a, pH3+ counts of control (mexTS>+), guts with Orai (Ca2+ channel) overexpressed in ECs (mexTS>Orai), nAChRβ3 reduced in ECs (mexTS>nAChRβ3RNAi-2) and combined (mexATS>nAChRβ3RNAi-2+ Orai) during Recovery d4 (Like Fig.1e). n=15 (mexTS>+), n=19 (mexTS>nAChRβ3RNAi-2), n=16 (mexTS>Orai), n=11(mexATS>nAChRβ3RNAi-2+ Orai) guts examined over 2 independent experiments. Statistics: Dunn’s Kruskal-Wallis test, p=0.013 (nAChRβ3RNAi-2 vs nAChRβ3RNAi-2+ Orai). b, Representative images of posterior midgut of flies as in Ext. Data Fig.5a. anti-pdm1: ECs (grey). Boxplot: pdm1+ cells over total nuclei per image (median, 1st and 3rd quartile, whiskers: minimum maximum values). n=10 (control), n=9 (nAChRβ3RNAi-2, Orai nAChRβ3RNAi-2+ Orai guts) guts examined over 2 independent experiments. Statistics: Tukey’s one-way Anova, p=0.0048 (nAChRβ3RNAi-2 vs Orai), p=0.0144 (nAChRβ3RNAi-2 vs nAChRβ3RNAi-2+ Orai). scale bar: 25μm. c, Representative images of posterior midguts assayed with MQAE (like Ext. Data Fig.4i) of myo1ATS>+, myo1ATS>Orai, myo1ATS>nAChRβ3RNAi-2 and myo1ATS>nAChRβ3RNAi-2 + Orai flies. Accompanying graph: fluorescence fold change per image. n=6 (myo1ATS>+), n=6 (myo1ATS>nAChRβ3RNAi-2), n=7(myo1ATS>Orai), n=7 (myo1ATS>nAChRβ3RNAi-2 +Orai) guts examined over 2 independent experiments. Statistics: Tukey’s one-way Anova, p=0.0002 (control vs nAChRβ3RNAi-2), p=0.0084 (Orai vs nAChRβ3RNAi-2), p=0.0441 (nAChRβ3RNAi-2 vs Orai + nAChRβ3RNAi-2). scale bar: 25μm. d, pH3+ counts from control (mexTS>+) and flies overexpressing parvalbumin in ECs (mexTS>PV). Conditions like Fig. 1e. Control: n=14 (Hom.), n=37 (Rec.d4) guts, mexTS>PV: n=17 (Hom.), n=30 (Rec.d4) guts examined over 3 independent experiments. Statistics: Dunn’s Kruskal-Wallis test. e, Validation of UAS-nAcRβ3. n=6 (control), n=3 (myo1ATS> nAcRβ3) biologically independent samples. Statistics: two-tailed Mann-Whitney test, p=0.0357. f, Validation of a’: mexLexA (mexLexA::GAD), scale bar: 200μm. Image is representative of 2 independent experiments with similar results; b’: LexAopnAChRβ3. n= 3 biologically independent samples per genotype. Statistics: two-tailed t-test, p=0.0012. g, a’: Representative color-coded sequential frames of mexTS>GCAM7c and mexTS>GCAM7c+nAChRβ3 guts before (t15) and after (t150) nicotine administration. b’: average relative fluorescence intensity (ΔF/F0) per frame (5 seconds per frame) and genotype. Conditions: 2 days standard food (29°C). N=6 guts per genotype examined over 2 independent experiments. c’: relative fluorescence intensity of each gut. Statistics: two-way Anova. scale bar: 25μm. h, Representative images of posterior midguts from control (mexLexATS>+/upd3>GFP) and when nAChRβ3 is overexpressed in ECs (mexLexATS> LexAopnAChRβ3 /upd3>GFP) together with upd3-Gal4 driving UAS-GFP (anti-GFP, white). Conditions like Fig. 3g. Accompanying graph: fluorescence fold change per image. n=8 (control), n=9 (mexLexATS> LexAopnAChRβ3) guts examined over 2 independent experiments. Statistics: two-tailed Mann-Whitney test, p=0.0002. scale bar: 100μm. i, Representative images of posterior midguts from mexLexATS>+/Egr-GFP and mexLexATS>LexAopnAChRβ3/Egr-GFP flies (anti-GFP, green). Conditions like Fig. 3g. Accompanying graph: fluorescence fold change per image. n=9 guts per genotype examined over 2 independent experiments. Statistics: two-tailed t-test, p=0.0006. scale bar: 25μm. j, Representative images of posterior midguts from control (mexTS>+) and mexTS>nAChRβ3 flies stained with anti-Dcp1(pink). Conditions like Fig. 3g. Accompanying graph: Dcp1+ cells per image. n=9 (control), n=13 (mexTS>nAChRβ3) guts per genotype examined over 2 independent experiments. Statistics: two-tailed Mann-Whitney test, p=0.0064. scale bar: 100μm. DAPI: nuclei (blue). PI: nuclei (Propidium iodide, red). *: 0.05>p>0.01, **: 0.01<p<0.001, ***: p<0.001. Data are presented as mean values ± SEM.

