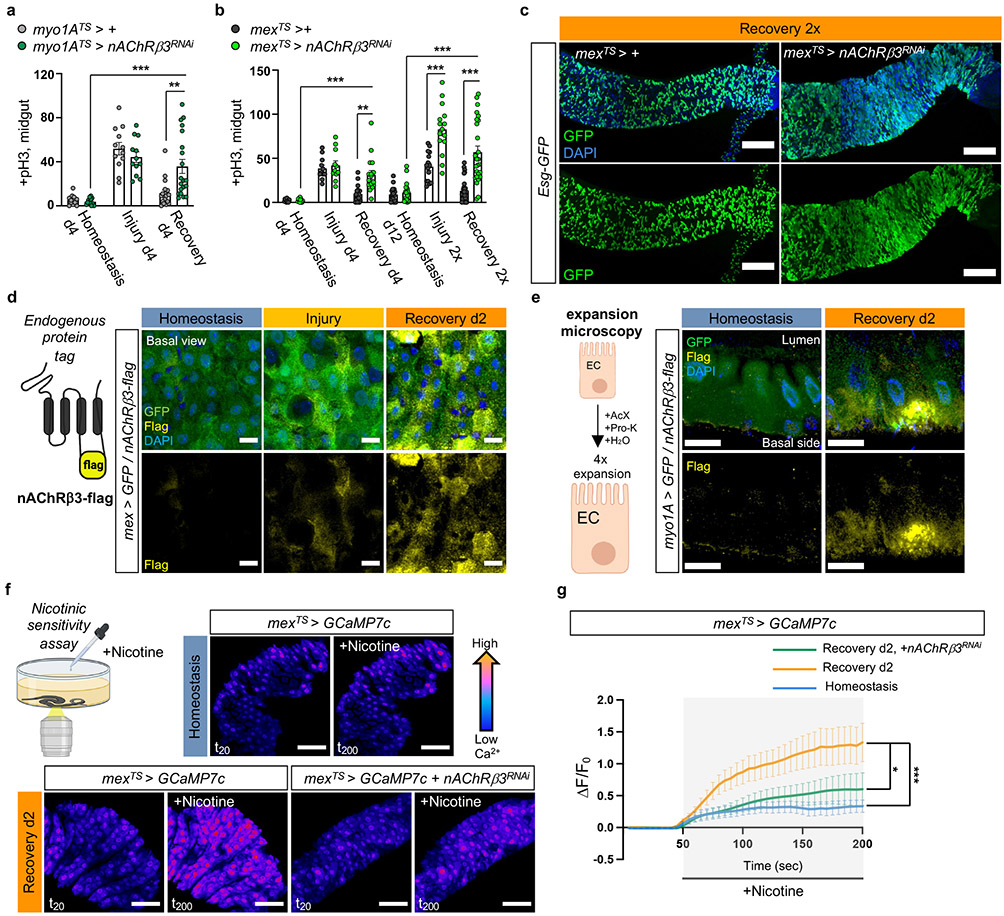
Fig.2 ∣. nAChRβ3 is required in ECs for recovery.
a, pH3+ counts from midgut of control (myo1ATS > +) and flies with nAChRβ3 conditionally reduced in ECs (myo1ATS> nAChRβ3RNAi). control: n=13 (Homeostasis), n=12(Injury), n=18(Recovery) guts, myo1ATS>nAChRβ3RNAi: n=13 (Homeostasis), n=12(Injury), n=20 (Recovery) guts, from 2 independent experiments. Sidak’s and Tukey’s two-way Anova. Like Fig. 1e. b, pH3+ counts from midgut of control (mexTS > +) and flies with nAChRβ3 conditionally reduced in ECs (mexTS>nAChRβ3RNAi). control: n=12 (Homeostasis), n=11(Injury), n=18(Recovery), n=20(Homeostasis d12), n=15(Injury 2x), n=29 (Recovery 2x); mexTS>nAChRβ3RNAi: n=12 (Homeostasis), n=11 (Injury), n=17 (Recovery), n=20 (Homeostasis d12), n=15 (Injury 2x), n=26(Recovery 2x), from 3 independent experiments. Sidak’s and Tukey’s two-way Anova. Like Fig. 1e-f. c, Confocal gut images of mexTS>+ and mexTS>nAChRβ3RNAi flies co-expressing the PC marker esg-GFP (green, anti-GFP, like Fig. 2b). scale bar: 100μm. Images are representative of 2 independent experiments with similar results. d, Illustration of nAChRβ3-flag and confocal images of midgut expressing nAChRβ3-flag and GFP-expressing ECs (mex >GFP). anti-Flag: nAChRβ3-flag (yellow), anti-GFP: ECs (green). scale bar: 10μm. Images are representative of 3 independent experiments with similar results. Like Fig. 1e. e, Illustration followed by images of expanded midguts from flies expressing nAChRβ3-flag (yellow) and GFP-expressing ECs (myo1A >GFP, green). scale bar: 50μm. Images are representative of 2 independent experiments with similar results. f-g, Illustration and color-coded sequential frames of midgut before (t20) and after (t200) nicotine administration of mexTS > GCaMP7c and mexTS > GCaMP7c+nAChRβ3RNAi flies (Videos S4-S6). Bottom graph: average relative fluorescence intensity (ΔF/F0) per frame (5 sec/frame) per condition and genotype. n=7(Homeostasis),n=7(Recovery d2),n=5 (Recovery d2, mexTS>Ace) guts from 2 independent experiments. Tukey’s two-way Anova (Rec d2 vs Rec d2+nAChRβ3RNAi, p=0.0116). Like Fig 1g. scale bar: 50μm. Individual ΔF/F0 on Ext. Data Fig.3k. DAPI: nuclei. *: 0.05>p>0.01, **: 0.01<p<0.001, ***: p<0.001. Mean ± SEM. Illustrations with Biorender.com

