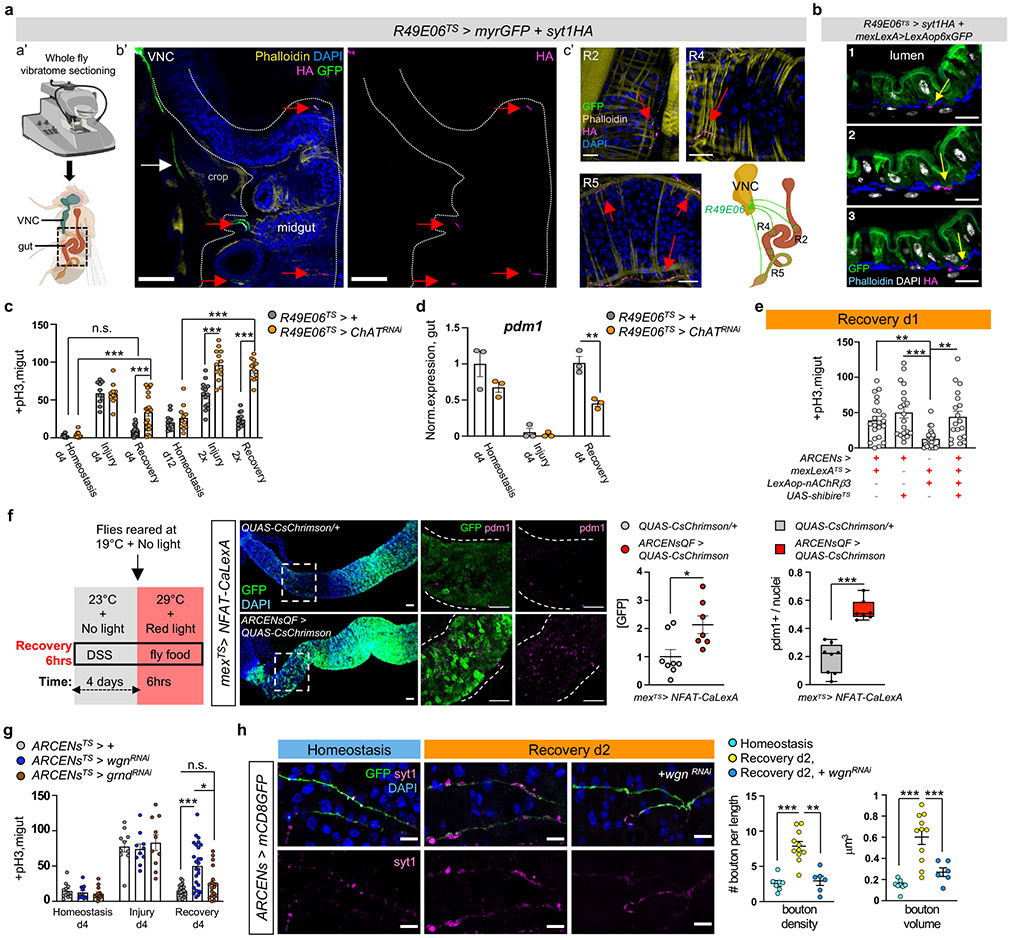
Fig.4 ∣. ARCEN-EC interactions promote recovery.
a, Vibratome-sectioning of R49E06TS>myrGFP+syt1HA flies (Rec.d2). a’-b’: sectioned thorax/abdomen (square). white dots: midgut. White arrow: R49E06-projection. c’: innervated R2, R4, R5. anti-GFP: R49E06-innervations(green), anti-HA: presynaptic syt1HA(magenta). Red arrow: R49E06-enteric innervations. Images b’-c’ are representative of 2 independent experiments with similar results. scale bar: 100μm(b’), 20μm(c’). b, Sequential R4 images (Video S7) from R49E06TS>syt1HA+mexLexA>6xLexAopGFP flies (Rec.d2). Arrows: anti-HA(magenta), anti-GFP: ECs(green). scale bar: 10μm. Images are representative of 2 independent experiments with similar results. c, +pH3 counts when ChAT (Choline Acetyltransferase) is reduced in R49E06-neurons (R49E06TS>ChATRNAi). Control: n=10(Hom.), n=10(Injury), n=16(Rec.d4), n=13(Hom.d12), n=14 (Injury 2x),n=13(Rec.2x) guts; R49E06TS>ChATRNAi: n= 10(Hom.), n=10(Injury), n=20(Rec.d4),n=11(Hom.d12),n=13(Injury 2x),n=12(Rec.2x) guts, from 2 independent experiments (Sidak’s two-way Anova). Like Fig.1e-f. d, Pdm1 expression levels. n=3 biologically independent samples. Sidak’s two-way Anova(p=0.0027). e, +pH3 counts when overexpressing nAcRβ3 in ECs (mexLexATS>lexAop-nAcRβ3) and thermo-silencing (>27°C) R49E06/ARCENs with shibireTS (ARCENs>shibireTS). Conditions: 4days DSS-food (23°C), 24hrs standard food (29°C). n=22(control), n=20(ARCENs>shibireTS), n=24(mexLexATS>lexAop-nAcRβ3), n=19(ARCENs>shibireTS+mexLexATS>lexAop-nAcRβ3) guts from 3 independent experiments. Dunn’s Kruskal-Wallis test: p=0.0029(control vs shibireTS), p=0.0024(shibireTS+lexAop-nAcRβ3 vs shibireTS). f, Thermo- and optogenetic induction with NFAT-CalexA expressed in ECs (mexTS>NFAT-CaLexA/QUAS-CsChrimson) after depolarizing ARCENs with CsChrimson (mexTS>NFAT-CaLexA/ARCENsQF>QUAS-CsChrimson). anti-GFP: Ca2+(green), anti-pdm1: ECs(magenta). Chart: GFP fold change, Boxplot: pdm1+ ratio (median, quartiles, whiskers: minimum maximum values). n=8(control), n=7(CsChrimson) guts from two independent experiments, two-tailed Mann-Whitney test (p=0.0205/GFP). scale bar: 50μm. g, pH3+ counts after reducing TNF receptors in ARCENs (wgn/wengen, ARCENsTS>wgnRNAi ; grnd/grindelwald, ARCENsTS>grndRNAi). control: n=12(Hom.), n=10(Injury), n=21(Rec.); wgnRNAi: n=12(Hom.), n=10(Injury), n=25(Rec.); grndRNAi: n=14(Hom.), n=10(Injury), n=19(Rec.) guts from 2 independent experiments. Dunn’s Kruskal-Wallis test: p=0.0185(wgnRNAi vs grndRNAi; Rec). h, R5 of ARCENs>mCD8GFP and ARCENs>mCD8GFP+wgnRNAi guts. anti-GFP: ARCENs-innervations(green), anti-Syt1: boutons(magenta). n=8(Hom.), n=11(Rec.), n=6(wgnRNAi) guts, from 2 independent experiments. Tukey’s one-way Anova (p=0.0019, Rec. vs wgnRNAi; boutons). scale bar: 10μm. Phalloidin: muscle. DAPI: nuclei. *: 0.05>p>0.01, **:0.01<p<0.001, ***:p<0.001. n.s.: non-significant. Mean ± SEM. Illustrations with Biorender.com

