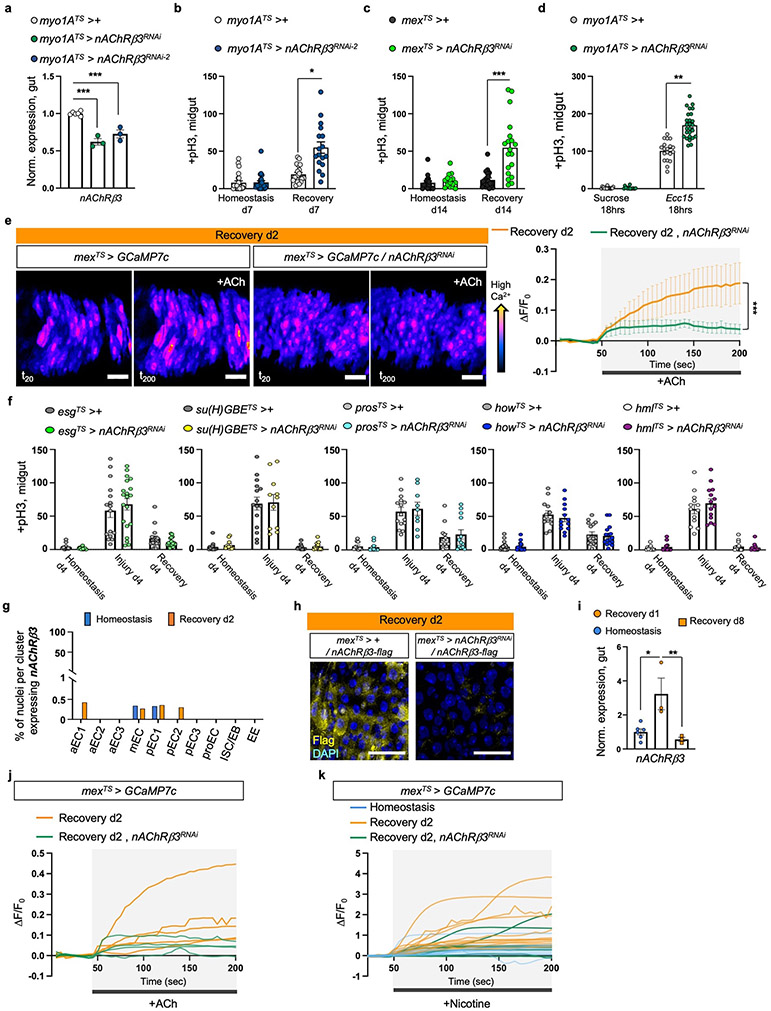
Ext. Data Fig.3 ∣. nAChRβ3 is required in ECs for recovery.
a, nAcRβ3RNAi validation. n=6 (control), n=3 (nAChRβ3RNAi , nAChRβ3RNAi-2 ) biologically independent samples. Statistics: Dunnett’s one-way Anova. b, pH3+ counts from control (myo1ATS>+) guts and when nAChRβ3 is reduced in ECs (myo1ATS>nAChRβ3RNAi-2). Recovery d7: 7 days standard food (29°C) after 4 days DSS-feeding (23°C). Homeostasis d7: 7 days standard food (29°C). p= 0.0496 (Dunn’s Kruskal-Wallis test). myo1ATS>+: n=23(Hom.), n=20(Rec. d7) guts; myo1ATS>nAChRβ3RNAi-2: n=23(Hom.), n=17(Rec. d7) guts, examined over 3 independent experiments. c, pH3+ counts from mexTS>+ and mexTS>nAChRβ3RNAi guts. Recovery d14: 14 days standard food (29°C) after 4 days of DSS-feeding (23°C). Homeostasis d14: 14 days standard food (29°C). p= 0.0007(Kruskal-Wallis test). mexTS>+ : n=16(Hom.), n=20(Rec. d14) guts; mexTS>nAChRβ3RNAi: n=16(Hom.), n=19(Rec. d14) examined over 3 independent experiments. d, pH3+ counts from myo1ATS>+ and myo1ATS >nAChRβ3RNAi guts after Ecc15 oral infection and after 5% sucrose feeding. Conditions like Ext. Data Fig.2g. p= 0.0099 (Dunn’s Kruskal-Wallis test). myo1ATS>+ : n=17 (Suc.), n=19 (Ecc15) guts; myo1ATS >nAChRβ3RNAi n=15 (Suc.), n=26 (Ecc15) guts examined over 3 independent experiments. e, Representative color-coded sequential frames before (fr20) and after (fr200) ACh administration from control (mexTS > GCAM7c) and mexTS > GCAM7c +nAChRβ3RNAi midguts (Like in Fig. 1g). scale bar: 25μm. Accompanying graph: average relative fluorescence intensity (ΔF/F0) per frame (5 seconds per frame) and per genotype. n=4 (control), n=5 (nAChRβ3RNAi ) guts examined over 2 independent experiments (two-way Anova). Individual ΔF/F0 per gut on Ext. Data Fig.3j. f, pH3+ counts from control and when reducing nAcRβ3 in PCs (esgTS>nAChRβ3RNAi), EBs (su(H)GBETS>nAChRβ3RNAi), EEs (prosTS> nAChRβ3RNAi), visceral muscle (howTS > nAChRβ3RNAi) and hemocytes (hmlTS> nAChRβ3RNAi). Conditions like Fig. 1e. Statistics: Sidak’s two-way Anova. esgTS>+ : n=16 (Hom., Injury) n=17 (Rec.) guts; esgTS>nAChRβ3RNAi: n=14(Hom.), n= 20(Injury), n=18(Rec) guts, over 2 independent experiments. Su(H)GBETS>+ : n=16(Hom.), n=15 (Injury), n=13 (Rec.) guts; Su(H)GBETS>nAChRβ3RNAi: n=11(Hom., Injury), n=15(Rec) guts examined over 2 independent experiments. prosTS>+ : n=10 (Hom.), n=15(Injury), n=12(Rec.) guts; prosTS>nAChRβ3RNAi: n=10(Hom.), n=9(Injury), n=13(Rec) guts examined over 2 independent experiments. howTS>+ : n=20(Hom.), n=13(Injury), n=16(Rec.) guts; howTS>nAChRβ3RNAi: n=19(Hom.), n=13(Injury), n=16(Rec) guts examined over 2 independent experiments. hmlTS>+ : n=12(Hom.), n=13(Injury), n=14(Rec.) guts; hmlTS>nAChRβ3RNAi: n=12(Hom.), n=14(Injury), n=13(Rec) guts examined over 2 independent experiments. g, Graph depicting percentage of nuclei expressing nAChRβ3 per snRNAseq gut cluster (n=7411 gut nuclei). h, nAChRβ3-flag validation: Midgut expressing nAChRβ3-flag (mexTS> +/nAChRβ3-flag) and when knocking down nAChRβ3 in ECs (mexTS>nAChRβ3RNAi/nAChRβ3-flag). anti-Flag: nAChRβ3-flag (yellow). DAPI: nuclei (blue). Images are representative of 2 independent experiments with similar results. scale bar: 25μm. i, nAChRβ3 expression levels in Ore R guts. Tukey’s one-way Anova: p= 0.0104(Hom. vs Rec. d1), p=0.0085(Rec. d1 vs Rec. d8). n= 6 (Hom.), n=3(Rec. d1, Rec. d8) biologically independent samples. j-k, Relative fluorescence intensity (ΔF/F0) per frame (5 seconds per frame) and genotype of each gut as described in Ext. Data Fig.3e and Fig. 2g, respectively. *: 0.05>p>0.01, **: 0.01<p<0.001, ***: p<0.001. Data are presented as mean values ± SEM.

