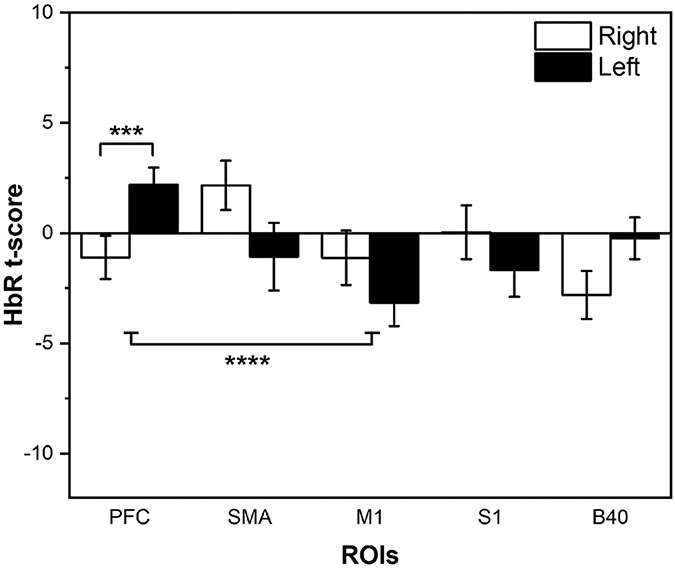
Fig. 6.
fNIRS t-scores for HbR collapsed across all Tasks and Conditions, depicted by ROI and Hemisphere. Mean and standard error (SE) values are shown. Significant differences at p < 0.005 (***) and p < 0.001 (****) are shown. White bars indicate right hemisphere, black bars indicated left hemisphere

