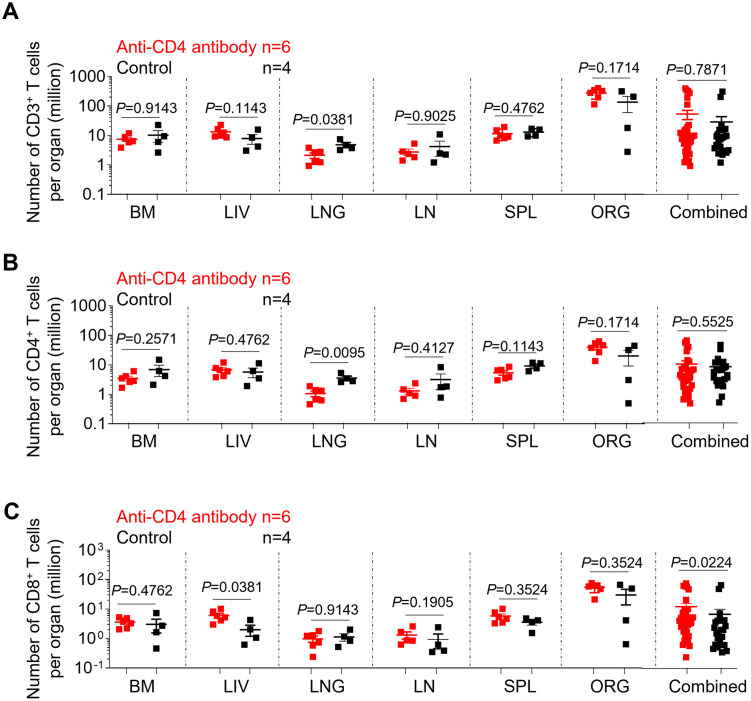
Fig 5. Systemic recovery of CD4+ T cell levels after antibody treatment termination in ART-suppressed, HIV-infected mice.
The absolute number of human CD3+ T cells (A), CD4+ T cells (B) and CD8+ T cells (C) in the tissues of anti-CD4 antibody-treated and control animals was determined by flow cytometry at necropsy. BM, bone marrow; LIV, liver; LNG, lung; LN, lymph nodes; SPL, spleen, ORG, human thymic organoid. Combined: all individual tissues from all animals are graphed together. Anti-CD4 antibody treated animals (n = 6) are shown in red; control animals (n = 4) are shown in black. Data are expressed as mean ± SEM. Statistical analyses were performed using unpaired two-sided Mann–Whitney U-tests. Statistical significance was considered when P < 0.05.

