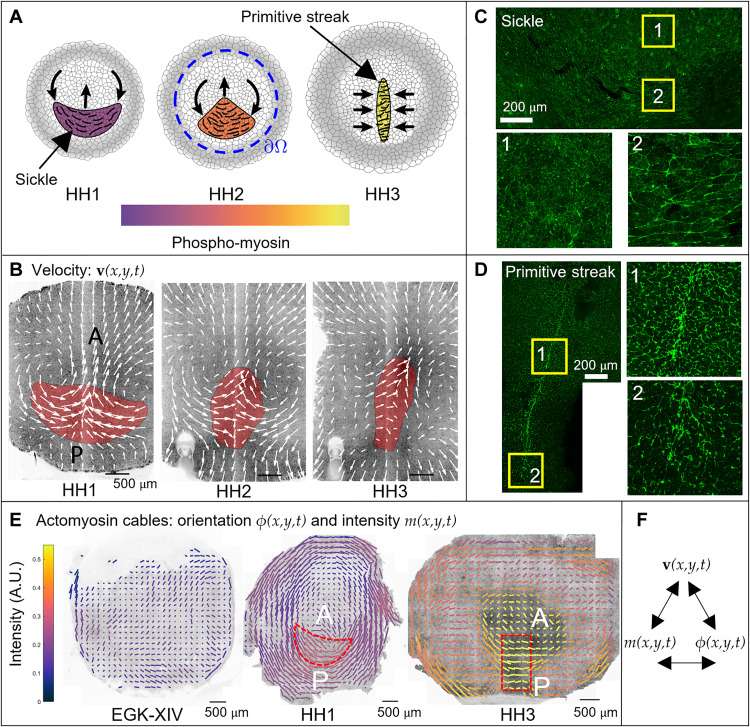
Fig. 1. Actomyosin cables drive the tissue flows in gastrulation.
(A) PS formation diagram. (B) Velocity in the chick gastrula. The convergent extension of the mesendoderm (red) generates macroscopic tissue flows on the surface of the embryo. (C) At HH1, the mesendoderm sickle territory is characterized by supracellular cables with active myosin (phosphorylated myosin light chain; pMLC) perpendicular to the anterior-posterior (AP) direction (see fig. S9 for details). (D) At HH3—12 hours after HH1—the PS is characterized by supracellular cables with high active myosin (pMLC) perpendicular to the midline. (E) The pattern of actomyosin cables evolves from EGK-XIV to HH3. Bar lengths represent the pMLC anisotropy and bar colors represent the measured absolute concentration. The red dashed sickle and rectangle indicate the mesendoderm precursors region and a stripe of tissue containing the PS. At HH3, the PS region has maximal pMLC intensity and maximal anisotropy perpendicular to the PS, resulting in the highest active stress along cables perpendicular to the PS. Figure S10 shows the same measured pMLC signal intensity as a scalar field over the embryo, demonstrating an overall increase in myosin activity. For experimental details, see (4). (F) Here, we construct a theoretical framework coupling velocity, actomyosin orientation, and intensity that explains observed gastrulation flows in recent experiments.

