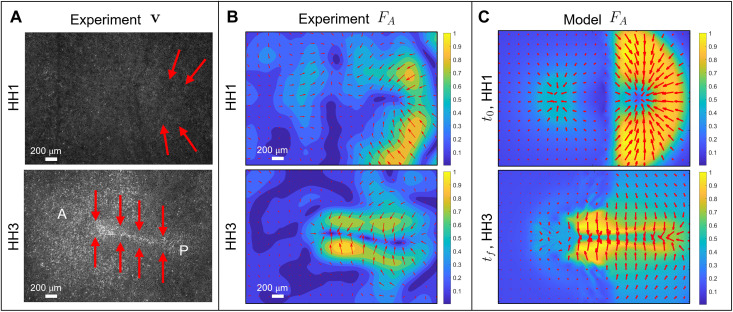
Fig. 3. Active forces in the chick embryo.
(A) Experimental fluorescence images at HH1 and HH3. A and P mark the anterior-posterior direction, and red arrows illustrate the dominant active force FA distribution from (B). At HH1, FA is dominant in the posterior embryonic region perpendicular to the AP axis. At HH3, FA is perpendicular to the PS throughout the AP axis. These FA configurations are consistent with the corresponding distribution of supracellular actomyosin cables in Fig. 1E. Dimensions are 1300 μm × 1900 μm. (B) and (C) Magnitude and direction of forces at HH1 (top) and HH3 (bottom). Magnitudes are normalized by the maximal spatial force. (B) We compute FA from the general force balance for highly viscous active flows FA + FV = 0 (cf. Eq. 1a), which gives FA = −(∇[∇ · v] + 2p1Δv), where the right-hand side can be computed using experimental velocities. We use an averaging filter in space (window size ≈25 μm) and time (window size ≈15 min) on the PIV velocities and compute velocity derivatives using finite differencing. (C) FA is from Eq. 1a. We note that the model FA at HH3 arises from the dynamical variables evolved by Eq. 1 over the entire gastrulation period. They closely predict the corresponding inferred experimental forces [(B) bottom], further validating our model.

