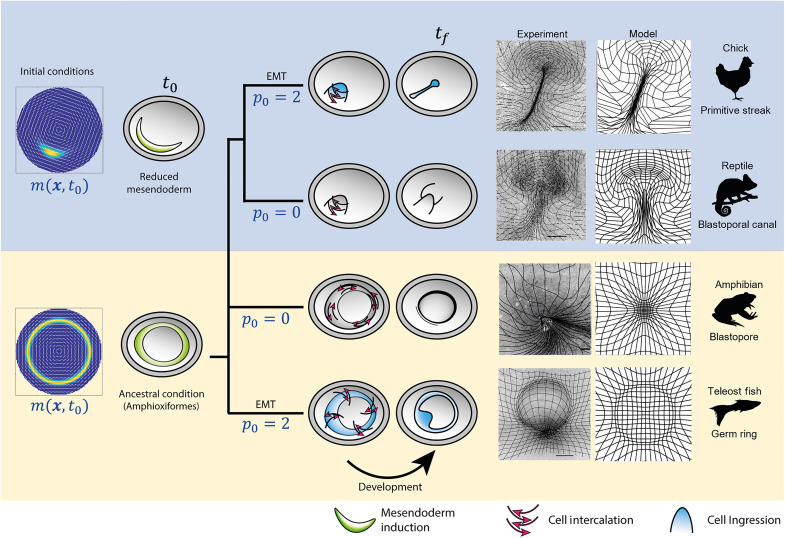
Fig. 5. Evolutionary transitions in gastrulation patterns.
A critical morphogenetic parameter p0 models the amount of EMT or active cell ingression caused by the cell’s propensity to ingress given apical myosin-induced isotropic contraction. The initial condition m(x, t0) models the extent of the mesendoderm precursor territory. Changing cell behaviors p0 and initial cell types m(x, t0) (left column), our model recapitulates the flow patterns in the phylogeny of vertebrate gastrulation from a self-organizing dynamical structure. Our model-based predicted flow patterns mimic those naturally observed in reptiles, amphibians, and fish, and are reproduced experimentally, in vivo, in the chick embryo [see also the recently published paper (4) for details on the experiments]. The right columns show deformed Lagrangian grids overlaying the light-sheet microscope images from perturbed chick-experiment velocities (4) and deformed Lagrangian grids from the predicted model velocity for each gastrulation mode. Scale bars, 500 μm.

