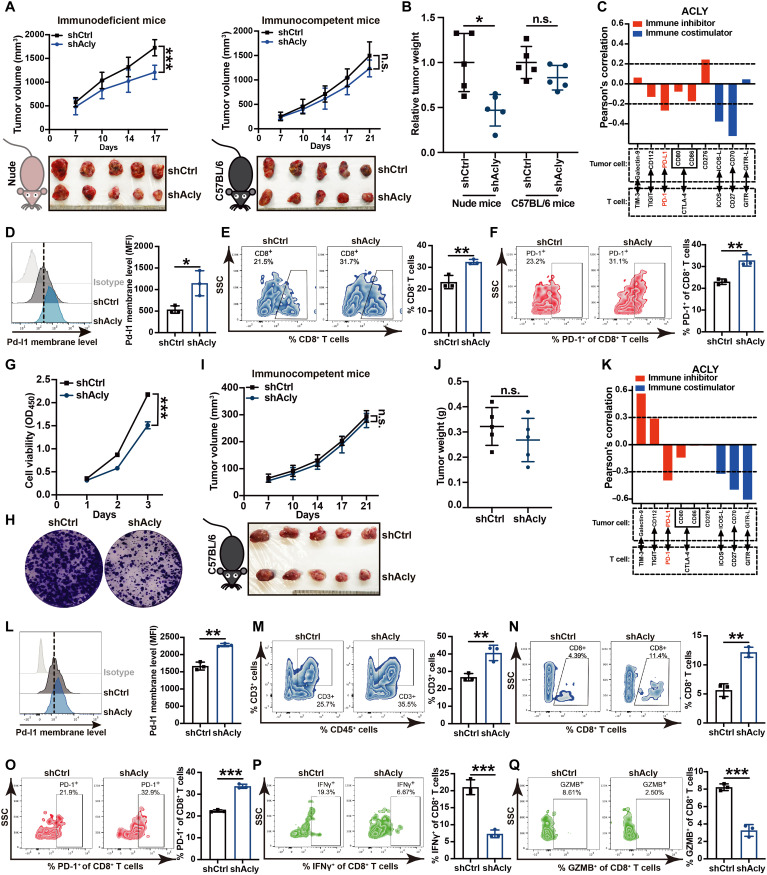
Fig. 1. ACLY inhibition up-regulates PD-L1 expression in cancer cells and induces T cell dysfunction.
(A and B) Tumor growth (A) and relative tumor burdens (B) in immunodeficient nude mice and immunocompetent C57BL/6 mice injected subcutaneously with shAcly or shCtrl Hepa1-6 cells for 2 to 3 weeks. One additional independent experiment was performed that yielded similar results [fig. S1, (C) and (D)]. (C) Pearson’s correlation between ACLY and T cell immune checkpoint molecules in human hepatocellular carcinoma (HCC) dataset (GSE45436) (n = 134 patients). (D) Flow staining and mean fluorescence intensity (MFI) of surface Pd-l1 of CD45− cells in indicated Hepa1-6 tumors. (E and F) Flow staining and frequency of indicated cells in indicated Hepa1-6 tumors. (G and H) CCK-8 (G) and plate colony formation assay (H) for assessing the cell proliferation of shAcly or shCtrl Pan02 cells. (I and J) Tumor growth (I) and tumor burdens (J) in C57BL/6 mice injected subcutaneously with shAcly or shCtrl Pan02 cells for 3 weeks. One additional independent experiment was performed that yielded similar results [fig. S1, (N) and (O)]. (K) Pearson’s correlation between ACLY and T cell immune checkpoint molecules in human PDAC dataset (GSE184585) (n = 82 patients). (L) Flow staining and MFI of surface Pd-l1 of CD45− cells in indicated Pan02 tumors. (M to Q) Flow staining and frequency of indicated cells in indicated Pan02 tumors. n = 5 mice per group from one independent experiment [(A), (B), (I), and (J)]; n = 3 biological replicates from one independent experiment [(D) to (F) and (L) to (Q)]; n = 5 biological replicates from one independent experiment (G). Statistical significance was assessed by two-way analysis of variance (ANOVA) [(A), (G), and (I)] and unpaired t test [(B), (D) to (F), (J), and (L) to (Q)]; *P < 0.05; **P < 0.01; ***P < 0.001; n.s., not significant; OD450, optical density at 450 nm.

