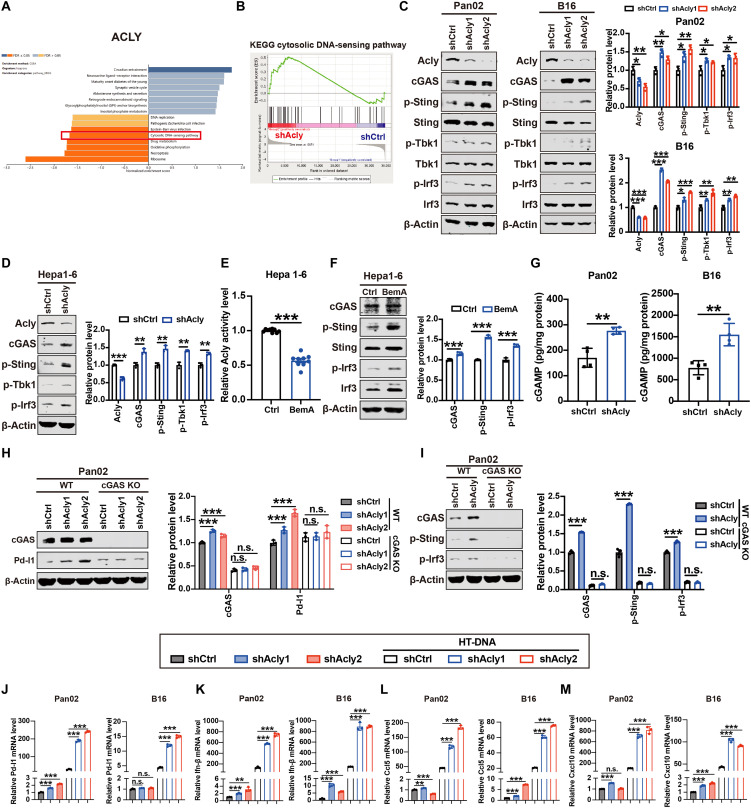
Fig. 2. ACLY inhibition leads to cGAS-STING activation.
(A) GSEA (KEGG pathway analysis) of ACLY in pancreatic cancer from TCGA. (B) GSEA analysis of RNA sequence data showing a significant enrichment of genes associated with cytoplasmic DNA sensing signaling in shAcly cells versus shCtrl cells. (C and D) Immunoblot analysis of Acly, cGAS, p-Sting, Sting, p-Tbk1, Tbk1, p-Irf3, and Irf3 expressions in Pan02, B16, and Hepa1-6 cells with Acly knockdown or not. (E) Quantification of ACLY activity by ELISA in Hepa1-6 cells with BemA treatment (30 μM) or not. (F) Immunoblot analysis of cGAS, p-Sting, and p-Irf3 expression in Hepa1-6 cells with BemA treatment (30 μM) or not. (G) Quantification of intracellular cGAMP levels by ELISA in Pan02 cells and B16 cells with Acly knockdown or not. (H) Immunoblot analysis of cGAS and Pd-l1 expression in cGAS knockout (KO) or wild-type (WT) Pan02 and B16 cells with Acly knockdown or not. (I) Immunoblot analysis of cGAS, p-Sting, and p-Irf3 expression in cGAS KO or WT Pan02 cells with Acly knockdown or not. (J to M) qPCR analysis of Pd-l1 (J), Ifn-β (K), Ccl5 (L), and Cxcl10 (M) mRNA expressions in Pan02 cells and B16 cells with Acly knockdown or not after HT-DNA stimulation. n = 3 biological replicates from one independent experiment (B and J to M); n = 3 biological replicates from three independent experiments [(C), (D), (F), (H), and (I)]; n = 9 biological replicates from three independent experiments (E) and data are shown as means ± SEM; n = 4 biological replicates from two independent experiments (G) and data are shown as means ± SEM. Statistical significance was assessed by one-way ANOVA [(C) and (H) to (M)] and unpaired t test [(D) to (G)]; *P < 0.05; **P < 0.01; ***P < 0.001.

