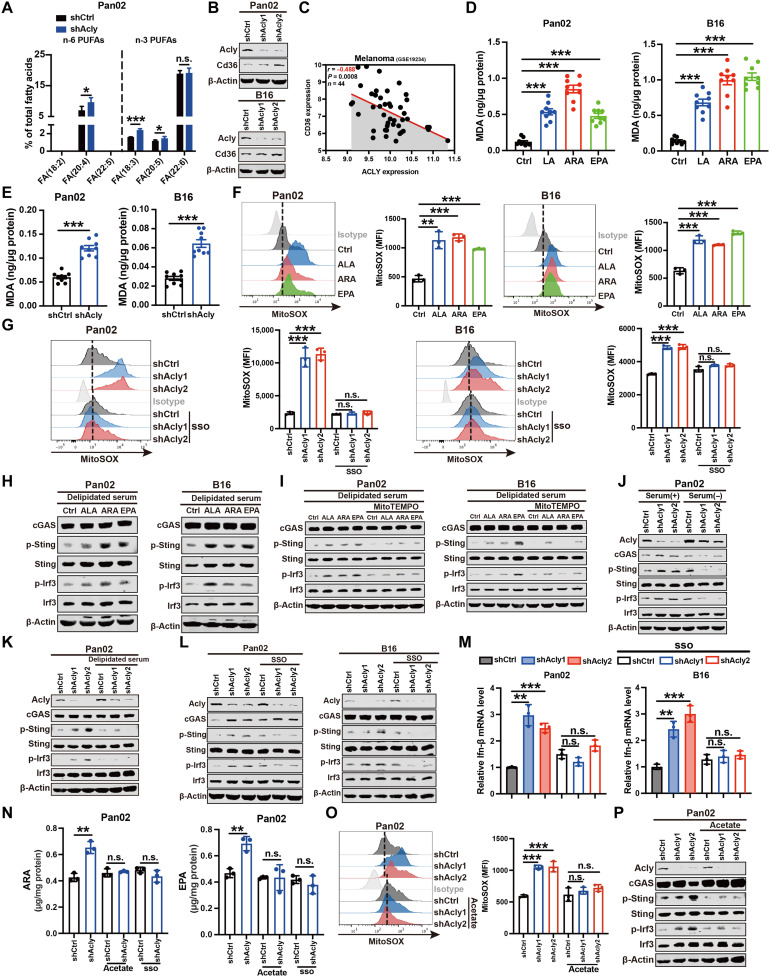
Fig. 4. ACLY inhibition causes PUFA peroxidation to induce mitochondrial damage and cGAS-STING activation.
(A) LC-MS lipidomic assay of the proportion of n-6 and n-3 PUFAs of total fatty acids in indicated cells. (B) Immunoblot analysis of Cd36 expression in indicated cells. (C) Pearson’s correlation between ACLY and CD36 expression in human melanoma dataset (n = 44 patients). (D and E) Quantification of malondialdehyde (MDA) contents by ELISA in indicated cells after PUFA treatment (50 μM) (D) or Acly deficiency (E). (F and G) Flow staining and MFI of mitoSOX in indicated cells after PUFA treatment (50 μM) (F) or sulfosuccinimidyl oleate (SSO) treatment (30 μM) (G). (H to L) Immunoblot analysis of indicated protein expressions in indicated cells after PUFA treatment (50 μM) (H), mitoTEMPO treatment (10 μM) (I), serum deprivation (J), delipidated serum treatment (K), or SSO treatment (30 μM) (L). (M) qPCR analysis of Ifn-β mRNA expression in indicated cells after SSO treatment (30 μM). (N) Quantification of intracellular ARA and EPA levels by ELISA in indicated cells after acetate treatment (5 mM) or SSO treatment (30 μM). (O) Flow staining and MFI of mitoSOX in indicated cells after acetate treatment (5 mM). (P) Immunoblot analysis of indicated protein expressions in indicated cells after acetate treatment (5 mM). n = 5 (A) and n = 3 [(F), (G), and (M) to (O)] biological replicates from one independent experiment; n = 3 biological replicates from three independent experiments [(B), (H) to (L), and (P)]; n = 9 biological replicates from three independent experiments [(D) and (E)] and data are shown as means ± SEM. The quantification [(B), (H) to (L), and (P)] was shown in fig. S3. Statistical significance was assessed by one-way ANOVA [(B), (D), and (F) to (P)] and unpaired t test [(A) and (E)]; *P < 0.05; **P < 0.01; ***P < 0.001.

