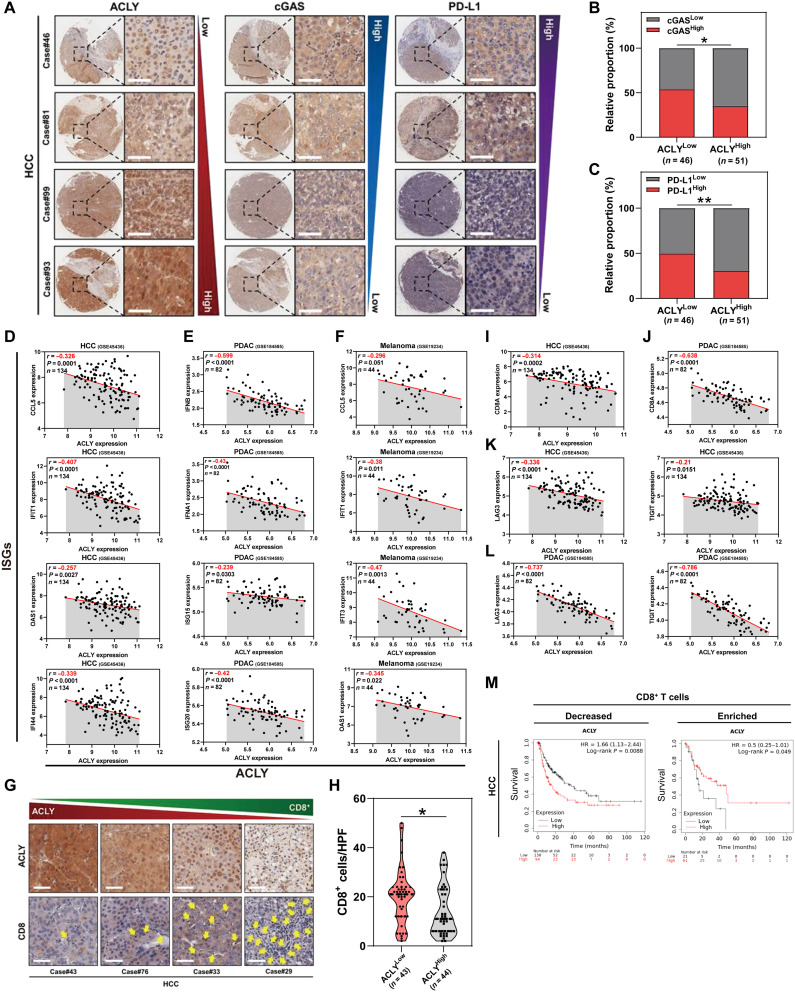
Fig. 5. Low ACLY expression correlates with cGAS-STING activation and exhausted T cell infiltration in human cancers.
(A to C) Immunohistochemical staining of ACLY, cGAS, and PD-L1 expression in patients with HCC (A). Scale bars, 50 μm. On the basis of the intensity of staining (protein expression), the patients were subdivided into two groups: low (staining scores 0 to 1) and high (staining scores 2 to 3) expression groups. Correlation analysis of ACLY expression with cGAS or PD-L1 expression in HCC tissues (B and C) (n = 97 patients). (D to F) Pearson’s correlation between ACLY expression and ISGs in HCC (D), PDAC (E), and melanoma (F) datasets (n = 134 patients with HCC, n = 82 patients with PDAC, n = 44 patients with melanoma). (G and H) Immunohistochemistry of clinical HCC samples reveals an inverse correlation between tumor ACLY expression (top) and CD8+ T cell infiltration (bottom). The yellow arrows represent CD8+ T cell infiltration (G). Scale bars, 50 μm. Correlation analysis of ACLY expression with CD8+ T cell number per HPF (n = 87 patients). The dashed line across the violin plots represents the quartiles and the full line depicts the median (H). (I and J) Pearson’s correlation between ACLY and CD8A expression in HCC (I) and PDAC (J) datasets. (K and L) Pearson’s correlation between ACLY expression and markers of T cell exhaustion (LAG3 and TIGIT) in HCC (K) and PDAC (L) datasets. (M) Kaplan-Meier analysis of survival in HCC according to the expression of ACLY in the group with decreased or enriched intratumoral CD8+ T cell infiltration. Statistical significance was assessed by Chi-square test [(B) and (C)] and unpaired t test (H); *P < 0.05; **P < 0.01.

