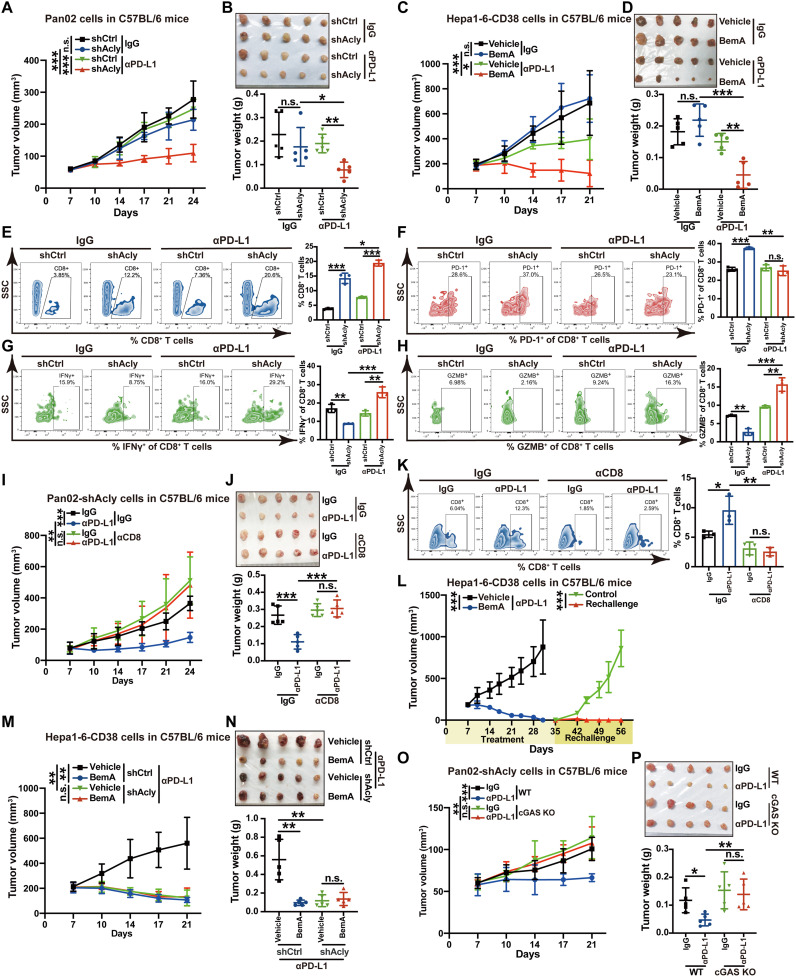
Fig. 6. ACLY inhibition overcomes cancer resistance to anti–PD-L1 therapy depending on cGAS.
(A and B) Tumor growth (A) and tumor burdens (B) in C57BL/6 mice injected subcutaneously with shAcly or shCtrl Pan02 cells with αPD-L1 antibodies treatment. One additional independent experiment was performed that yielded similar results (fig. S5, A and B). (C and D) Tumor growth (C) and tumor burdens (D) in C57BL/6 mice injected subcutaneously with Hepa1-6–CD38 cells with treatment of BemA and αPD-L1 antibodies either alone or in combination. (E to H) Flow staining and frequency of indicated cells in tumors of indicated groups. (I and J) Tumor growth (I) and tumor burdens (J) in C57BL/6 mice injected subcutaneously with Pan02 cells with Acly deficiency with the treatment of αPD-L1 antibodies after CD8 depletion. (K) Flow staining and frequency of CD8+ T cells in tumors of indicated groups. (L) Tumor growth in C57BL/6 mice reinjected subcutaneously with Hepa1-6–CD38 cells after complete tumor regression by BemA combined with αPD-L1 treatment (n = 6 mice for combined treatment and n = 5 mice for tumor rechallenge). (M and N) Tumor growth (M) and tumor burdens (N) in C57BL/6 mice injected subcutaneously with shAcly or shCtrl Hepa1-6–CD38 cells with treatment of BemA and αPD-L1 antibodies either alone or in combination. (O and P) Tumor growth (O) and tumor burdens (P) in C57BL/6 mice injected subcutaneously with shAcly Pan02 cells with cGAS KO or not after the treatment of αPD-L1 antibodies. n = 5 mice per group from one independent experiment [(A) to (D), (I), (J), and (M) to (P)]; n = 3 biological replicates from one independent experiment [(E) to (H) and (K)]. Statistical significance was assessed by two-way ANOVA [(A), (C), (I), (L), (M), and (O)] and one-way ANOVA [(B), (D) to (H), (J), (K), (N), and (P)]; *P < 0.05; **P < 0.01; ***P < 0.001.

