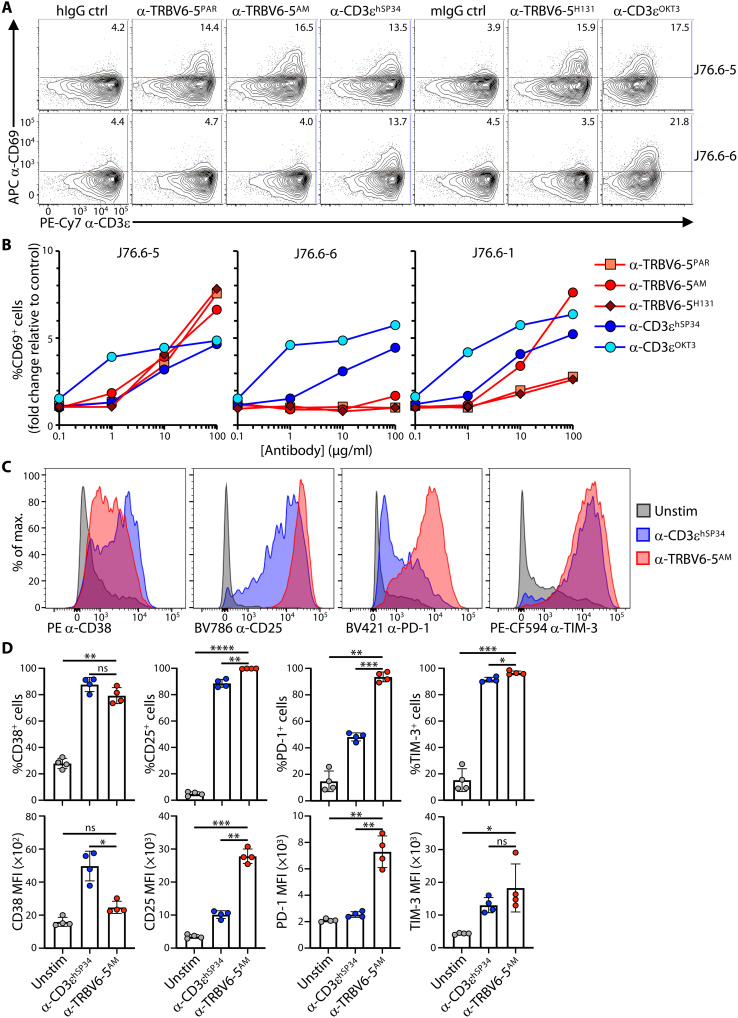
Fig. 2. Stimulatory activity of α-TRBV antibodies.
(A) J76 cells coexpressing a TRAV24+ TCRα chain and a TRBV6-5+ (J76.6-5) or TRBV6-6+ (J76.6-6) TCRβ chain were seeded on the indicated plate-bound antibodies (10 μg/ml), incubated for 4 hours at 37°C, and then stained for analysis of CD69 up-regulation by flow cytometry. Representative of two independent experiments. (B) J76 cells coexpressing a TRAV24+ TCRα chain and a TRBV6-5+ (J76.6-5), TRBV6-6+ (J76.6-6), or TRBV6-1+ TCRβ chain were incubated for 4 hours at 37°C with increasing concentrations of the indicated plate-bound antibodies and then stained for analysis of CD69 up-regulation by flow cytometry. Representative of two independent experiments. (C and D) Purified T cells were cultured for 7 days without (Unstim) or with the indicated plate-bound antibodies in complete media supplemented with IL-2 and IL-15 and then stained for the indicated activation markers for analysis by flow cytometry after gating on TRBV6-5+ cells. Representative histograms and summary data of the percentage of positive cells and MFI for n = 4 donors are shown in (C) and (D), respectively. In (D), data are shown as mean ± SD. ns, not significant; *P < 0.05; **P < 0.01; ***P < 0.001; ****P < 0.0001 [paired analysis of variance (ANOVA) with Dunnett’s method, comparing α-TRBV6-5AM to every other condition individually].

