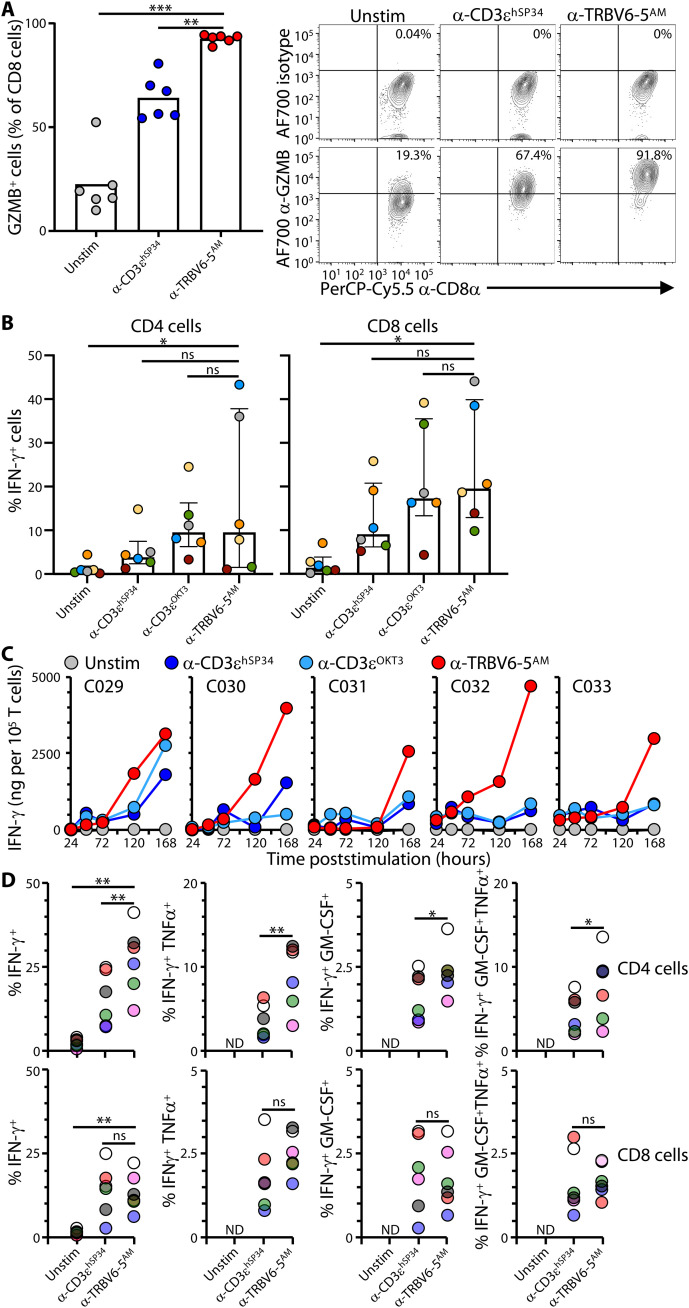
Fig. 4. α-TRBV–induced effector responses.
(A) Purified T cells were cultured as in Fig. 2 (C and D) without (Unstim) or with the indicated plate-bound antibodies for 7 days then stained intracellularly for GZMB or a matching isotype control for analysis by flow cytometry. Data are shown as mean ± SD of n = 6 donors. **P < 0.01; ***P < 0.001 (paired ANOVA with Dunnett’s method, comparing α-TRBV6-5AM to every other condition individually). Representative contour plots for one donor are shown on the right. (B) Purified T cells were cultured as in Fig. 2 (C and D) without (Unstim) or with the indicated plate-bound antibodies for 3, 5, and 7 days and then stained intracellularly for IFN-γ or a matching isotype control for analysis by flow cytometry in CD4 (top row) and CD8 (bottom row) cells. Data are shown as mean ± SD of n = 6 donors. *P < 0.05 (paired ANOVA with Dunnett’s method, comparing α-TRBV6-5AM to every other condition individually). Summary data for all time points are shown in fig. S4A. (C) Purified T cells from n = 5 donors were cultured as in Fig. 2 (C and D) without (Unstim) or with the indicated plate-bound antibodies, and supernatants were collected at the indicated time points to evaluate the cumulative secretion of IFN-γ by flow cytometry using the TH response and antiviral response LEGENDplex assays. (D) Purified T cells were cultured as in Fig. 2 (C and D) without (Unstim) or with the indicated plate-bound antibodies for 7 days and then stained intracellularly for IFN-γ, GM-CSF, and TNFα for analysis by flow cytometry in CD4 (top row) and CD8 (bottom row) cells. Each color represents a different donor (n = 6). ND, not determined; *P < 0.05; **P < 0.01 (paired ANOVA with Dunnett’s method, comparing α-TRBV6-5AM to every other condition individually for IFN-γ+ cells; paired t test for cells producing multiple cytokines).

