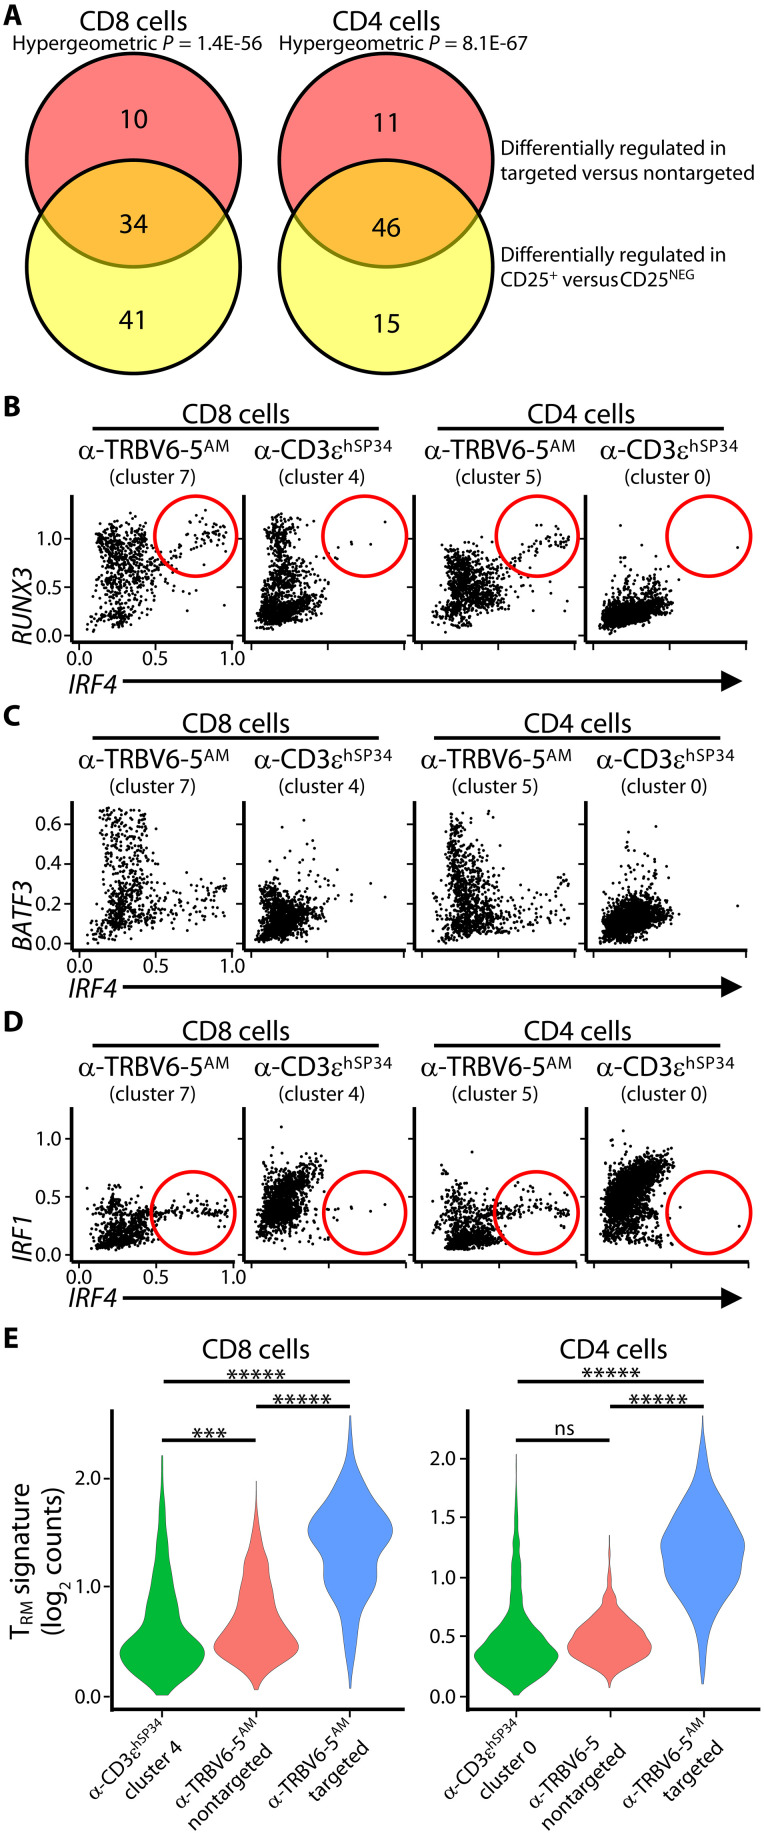
Fig. 7. Transcription factor profile and validation of α-TRBV stimulated cells.
(A) Venn diagrams showing the number of transcription factors (TFs) that are uniquely and commonly up/down-regulated across groups. Only TFs that were significantly differentially expressed were included. Significance calculated using hypergeometric test. (B to D) Scatterplots with the imputed expression of genes highlighted, divided by cell type and treatment groups. (E) Violin plots representing the overall expression of genes in the TRM gene signature. The y axis indicates the log2 of the raw counts. ***P < 0.001; *****P < 2.22 × 10⁻¹⁶.

