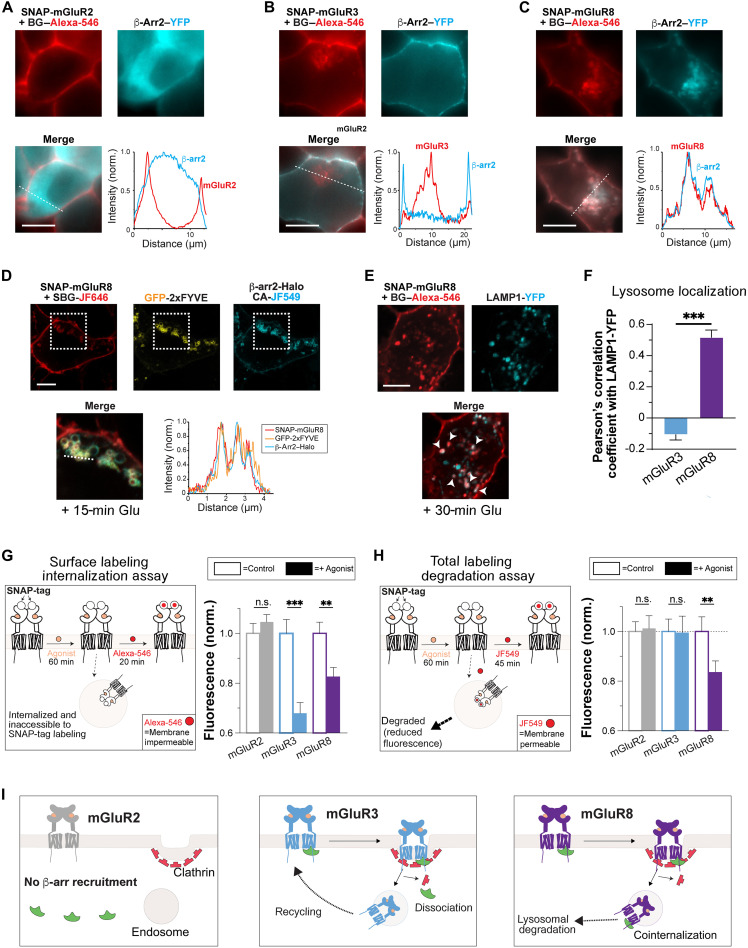
Fig. 1. mGluR8, but not mGluR2 or mGluR3, cointernalizes with β-arrs and undergoes lysosomal targeting and degradation.
(A to C) Representative live HEK 293T cell images and line scan profiles (from dotted lines) showing SNAP-mGluR2 (A), SNAP-mGluR3 (B), or SNAP-mGluR8 (C) in red with β-arr2–YFP in green after 30 min with 1 mM glutamate. (D) Scanning confocal images of live cells showing colocalization of SNAP-mGluR8 (red) with endosomal marker, GFP-2xFYVE (green), and β-arr2–Halo (cyan) in live cells. Zoomed in, merged image is from the dotted box area. (E) Scanning confocal images of fixed cells showing colocalization of SNAP-mGluR8 (red) and Lamp1-YFP (green) in cells fixed after 30 min of treatment with 1 mM Glu. (F) PCC analysis comparing the top 10% of pixels between SNAP-mGluR3 and SNAP-mGluR8 with Lamp1-YFP. (G) Schematic of surface labeling internalization assay (left). Surface fluorescence intensity levels from live cells expressing SNAP-tagged mGluRs treated with agonist (1 mM Glu) for 60 min or control conditions (antagonist; see Materials and Methods) before labeling with membrane impermeable fluorophore, BG–Alexa-546. Values are normalized to the fluorescence of a given receptor under control/antagonist conditions. (H) Schematic of total labeling degradation assay (left). Total fluorescence levels from live cells expressing SNAP-tagged mGluRs treated with agonist (1 mM Glu) for 60 min or control (antagonist; see Materials and Methods) before labeling with membrane permeable fluorophore, BG-JF-549. Values are normalized to the fluorescence of a given receptor under control/antagonist conditions. (I) Schematics summarizing the major differences between subtypes. Upon agonist treatment, mGluR2 does not recruit β-arrs and stays on the plasma membrane. mGluR3 recruits β-arrs but dissociates during endocytosis and later recycles back to the membrane. mGluR8 cointernalizes with β-arrs and traffics to lysosomes for degradation. Scale bars, 10 μm. Data are represented as means ± SEM. Unpaired t tests, **P < 0.01 and ***P < 0.001. n.s., not significant.

