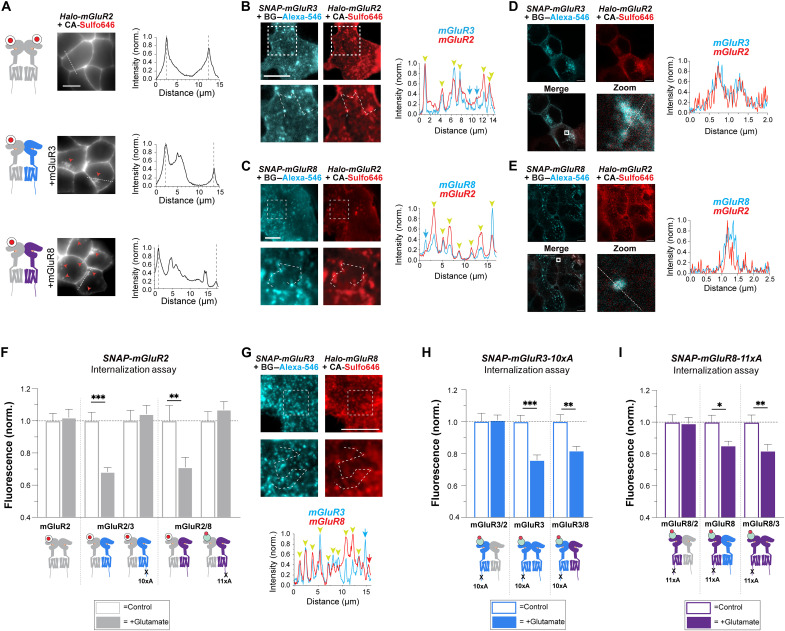
Fig. 5. Functional evidence for internalization of mGluR heterodimers.
(A) Fluorescence live cell images and line scan profiles (from dotted lines) of Halo-mGluR2 alone (top) or coexpressed with either untagged mGluR3 (middle) or mGluR8 (bottom) 30 min after 1 mM Glu application. Red arrows indicate internalized mGluR2 fluorescence. (B and C) TIRF images of cells expressing Halo-mGluR2 with either SNAP-mGluR3 (B) or SNAP-mGluR8 (C) following 10 to 15 min of Glu treatment. Zoomed images are from the dotted box area. Line scan profiles show the colocalization of receptor puncta. (D and E) STED images of cells expressing Halo-mGluR2 with either SNAP-mGluR3 (D) or SNAP-mGluR8 (E) following 30 min of Glu treatment. Zoomed images are from the dotted box area. Line scan profiles show the colocalization of receptor puncta. Scale bars, 5 μm. (F) Quantification of SNAP-mGluR2 internalization using surface labeling assay upon coexpression with other mGluR subunits. When coexpressed with mGluR3 or mGluR8, SNAP-mGluR2 showed decrease in surface fluorescence. When mGluR3-10xAla or mGluR8-11xAla was coexpressed, SNAP-mGluR2 did not show internalization. (G) TIRF images of cells expressing Halo-mGluR3 with SNAP-mGluR8 following 10 to 15 min of Glu treatment. Zoomed images are from the dotted box area. Line scan profiles show the colocalization of receptor puncta. (H and I) Surface labeling assay data showing evidence for mGluR3/8 heterodimers. Internalization deficient mGluR3 (10xA) or mGluR8 (11xA) constructs show a clear drop in surface fluorescence upon coexpression with wild-type mGluR3 or mGluR8 but not mGluR2. One-way ANOVA test, *P < 0.05, **P < 0.01, and ***P < 0.001. Data are represented as means ± SEM.

