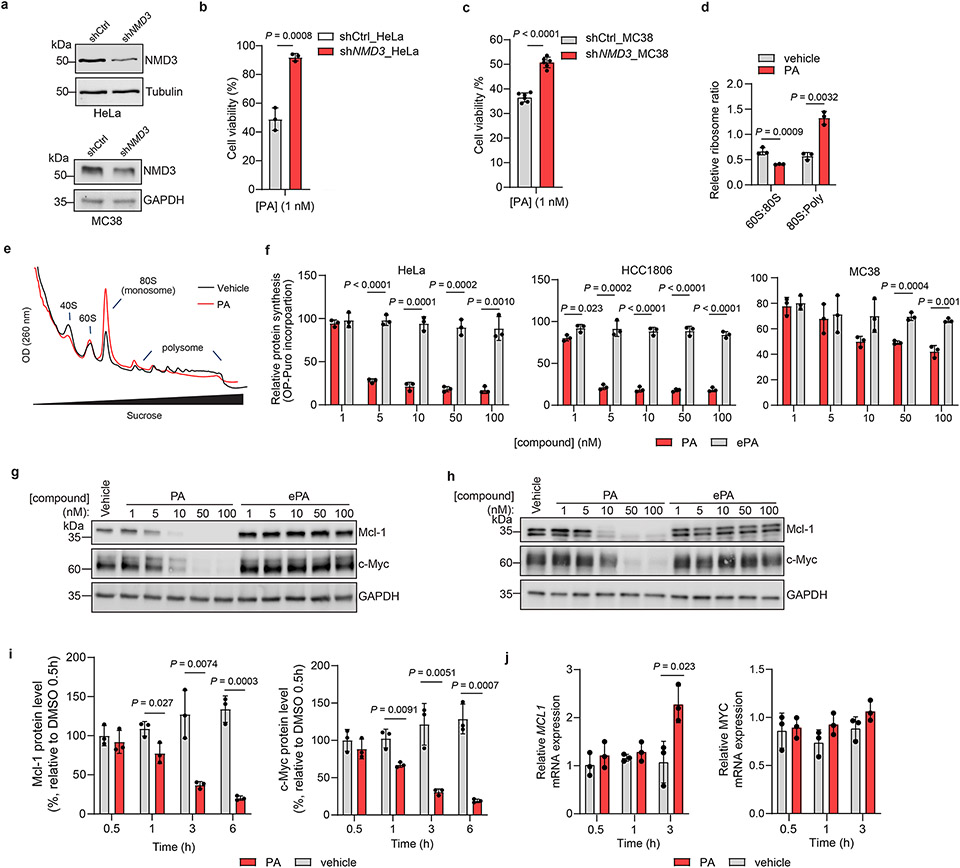
Extended Data Fig. 6 ∣. Portimine A activity dependent on NMD3 and impairs polysome formation.
(a) Immunoblot of NMD3 in HeLa and MC38 cells expressing control or NMD3-specific shRNAs. (b-c) PA has reduced viability effects in Jurkat cells transduced with shRNA targeting NMD3 compared to shCtrl cells in HeLa (b, 1 nM, 24 h) and MC38 (c, 1 nM, 48 h). Data presented as mean ± s.d. of biologically replicated experiments (n = 3 for HeLa, n = 6 for MC38). Statistical analysis was performed using unpaired two-tailed Student t-test, P-values are shown. (d) Quantitation of 60S:80S ratio and 80S:polysome ratio from data shown in Fig. 4f. Presented as mean ± s.d. of biological replicates (n = 3). Statistical analysis performed using unpaired two-tailed Student t-test; P-values are shown. (e) Polysome profiling of MC38 cells treated with PA (50 nM, 6 h). Results are representative of two independent experiments. (f) PA, but not ePA, inhibits new protein synthesis in HeLa, HCC1806, and MC38 cells as determined by O-propargyl puromycin (OPP) incorporation. Results normalized to vehicle and presented as the mean ± s.d. across biologically replicated experiments (n = 3). Statistical analysis was performed using multiple unpaired two-tailed Student t-test. P-values are shown. (g, h) Immunoblot of Mcl-1 and c-Myc after PA and ePA treatment in g) Jurkat and h) MC38 cells. Results are representative of two independent experiments. (i) Quantitation of protein abundances from Fig. 4j. Results presented as mean ± s.d. of biologically replicates (n = 3). Statistical analysis was performed using multiple unpaired two-tailed Student t-test; P-values are shown. (j) MCL1 and MYC mRNA expression assessed by quantitative PCR in Jurkat cells treated with PA (10 nM). Results normalized to vehicle and values indicate mean ± s.d. (n = 3 biologically independent samples). Statistical analysis performed using multiple unpaired two-tailed Student t-test. P-values are shown. For uncropped western blot images, see Supplementary Fig. 3.

