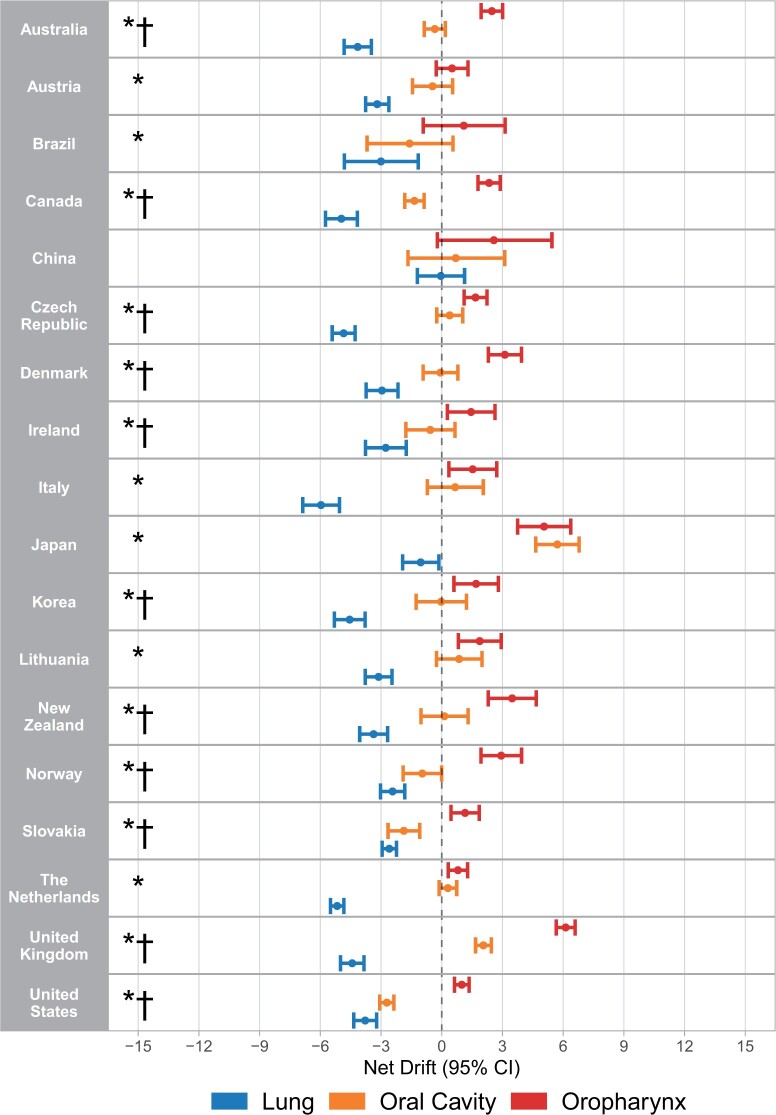
Figure 2.
Net drifts calculated using age period–cohort analysis for oropharyngeal cancer, oral cavity cancer, and squamous cell carcinoma of the lung in men for countries with increasing incidence of oropharyngeal cancer in log-linear regression. * = net drift for oropharyngeal cancer greater than squamous cell carcinoma of the lung (P < .05), † = net drift for oropharyngeal cancer greater than oral cavity cancer (P < .05). CI = confidence interval.

