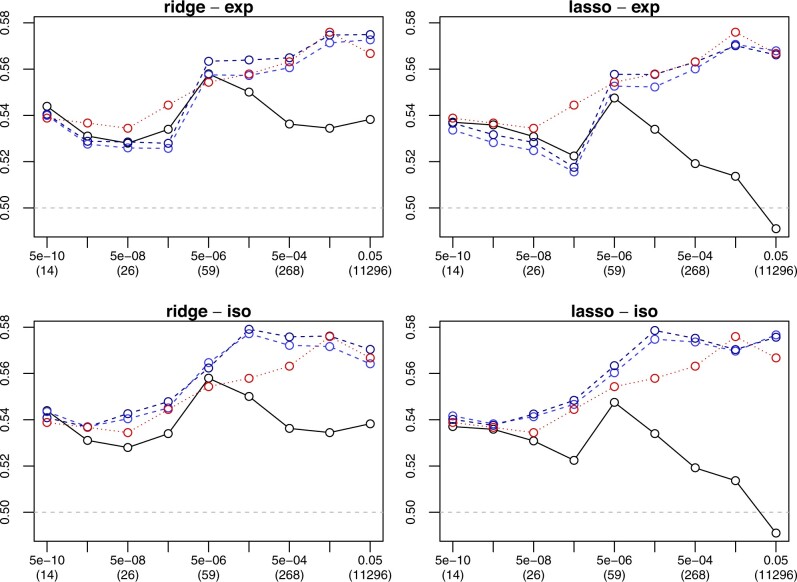
Figure 3.
Predictive performance in internal application. Mean cross-validated area under the ROC curve (AUC) from 10 times 10-fold cross-validation (y-axis) against P-value cutoff (x-axis) for regression without (solid line) and with (dashed lines) transfer learning (bright blue: standard stacking, dark blue: simultaneous stacking), under either ridge (left) or lasso (right) regularization and either exponential (top) or isotonic (bottom) calibration. The numbers within brackets indicate the dimensionality, and the dotted line is for naïve transfer learning. While represents random classification, represents perfect classification. Given 766 controls and 790 cases, a random classifier achieves an above 0.524 in 5% of the cases.

