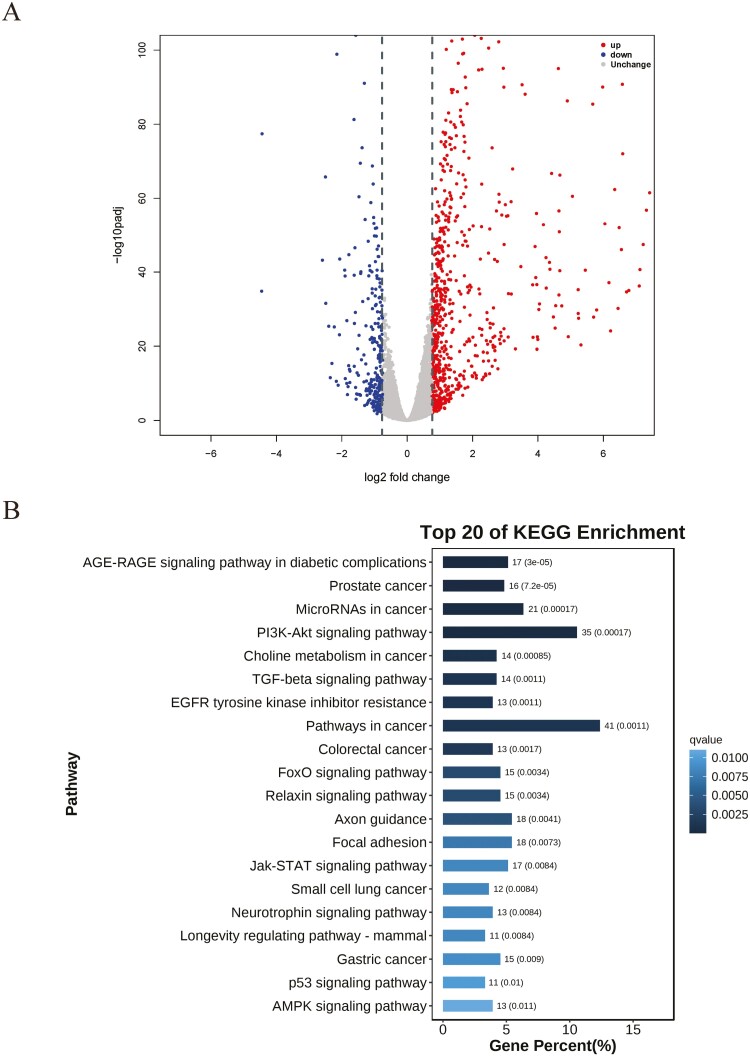
Figure 2.
RNA-seq analysis between control and FoxO1 overexpression group. (A) Volcano plot of differentially expressed genes (DEGs) between control and FoxO1 overexpression group. Red dots represent up-regulated genes, and blue dots represent down-regulated genes (B) The top 20 KEGG signaling pathways enriched of DEGs between control and FoxO1 overexpression groups.

