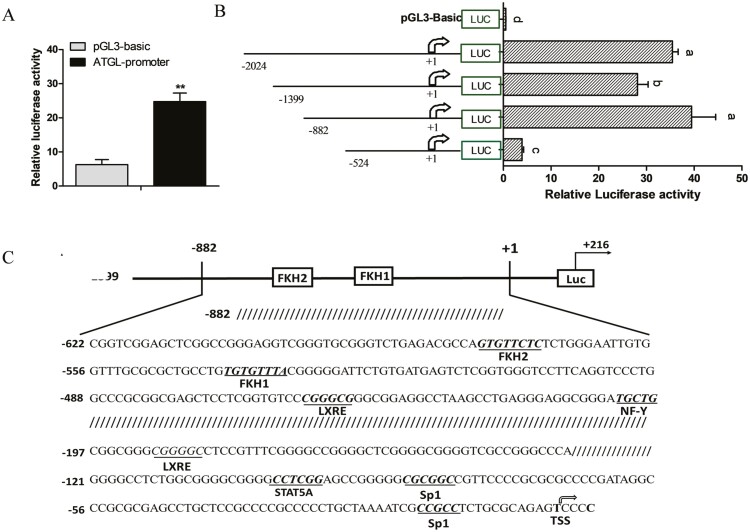
Figure 4.
Deletion analysis and characterization of ATGL promoter. (A) Relative luciferase activity of ATGL promoter. GMECs were co-transfected with ATGL promoter and TK-Renilla luciferase vector for 48 h. (B) Relative luciferase activity analysis of deletion fragments of ATGL promoter. GMECs were transfected with different lengths of ATGL promoter (−2024 bp/+216 bp, −1399 bp/+216 bp, −882 bp/+216 bp, −524 bp/+216 bp) for 48 h. Three independent replicates were shown as mean ± SEM. **P < 0.01 vs. control. Different lowercase letters represent significant differences between different groups (P < 0.05); the same lowercase letters mean no significant differences among groups (P > 0.05). (C) Schematic representation of goat ATGL promoter region. The position of transcription factor predicted binding sites was underlined, and the transcription start site was indicated by a black arrow.

