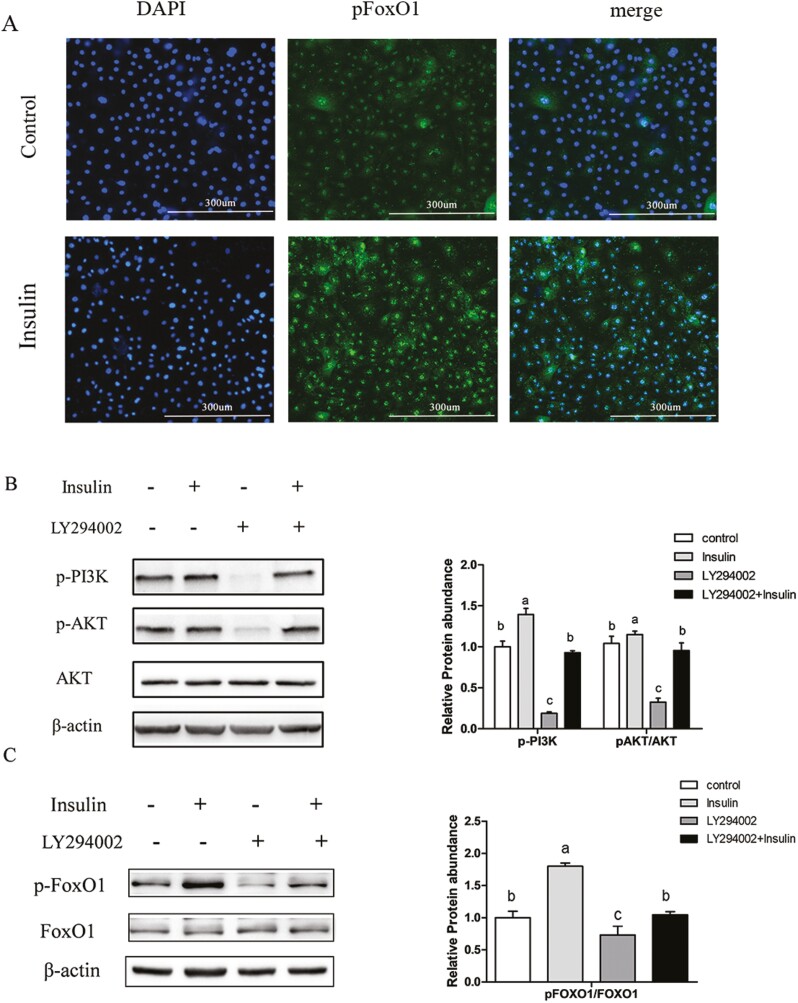
Figure 8.
The transcriptional activity of FoxO1 was regulated by insulin through the PI3K/Akt signaling pathway. (A) Immunofluorescence staining of pFoxO1 in cells incubated with or without insulin. GMECs (1 × 10⁵) were seeded into 12 well plates and incubated overnight. Cells were incubated with serum-free medium for 12 h, followed by incubation with or without insulin for 24 h. The levels of cytosolic pFoxO1 were examined (n = 3). Scale bar = 300 μm. (B) Levels of phosphorylated AKT (pAKT)and PI3K(p-PI3K) proteins determined by western blot in GMECs. Cells were plated into 60 mm dishes and treated with insulin or LY294002 for 24 h, protein abundances of p-PI3K, p-AKT, and AKT were measured. Relative protein abundance was normalized to β-actin or total kinase. (C) Total FoxO1 and pFoxO1 protein levels in GMECs incubation with insulin or LY294002 (panel left); quantitative analysis of pFoxO1 in GMECs (panel right). Protein abundance was calculated by Image J software. One-way ANOVA was used for multiple comparisons followed by Duncan’s test. Data were presented as mean ± SEM for three independent experiments. All experiments were repeated three times. Different lowercase letters represent significant differences between different groups, while the same lowercase letters mean no significant differences among groups.

