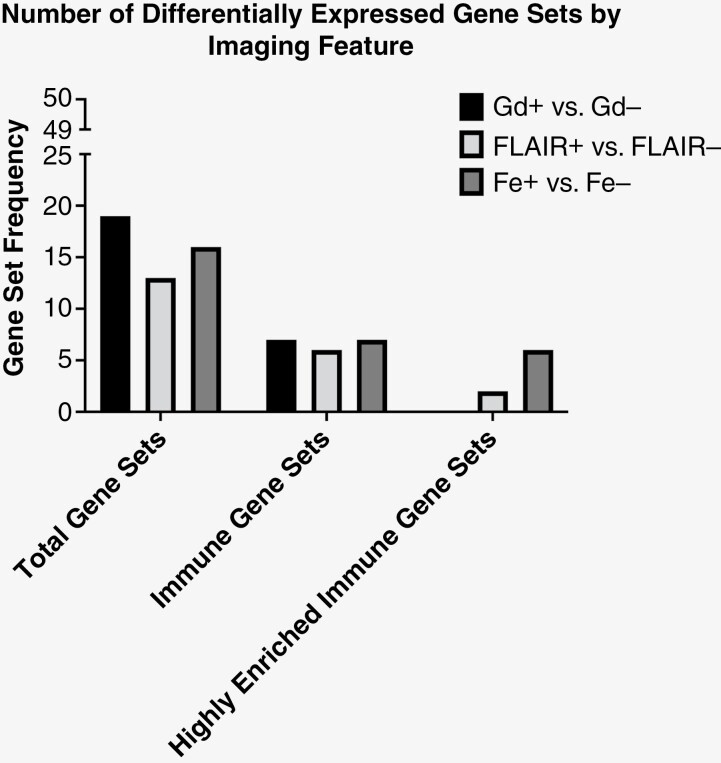
Figure 1.
Differential gene expression by MRI phenotype. Differing MRI phenotypes demonstrated various degrees of differential gene expression. For all possible gene sets (N = 50), Gd was found to have the greatest degree of differential expression (N = 19). However, FLAIR (N = 13) and Fe (N = 16) also showed similar findings. When analysis is confined to only knowing immune-related processes (middle, immune gene sets). We observed similar differential expression between all of the 3 MRI phenotypes. However, when differential expression of these immune gene sets is further stringently controlled (right, highly enriched) with an NES of 2.5, we observed the Fe MRI phenotype to have the highest number of highly differentially expressed immune gene sets (N = 6). Conversely, no highly enriched immune gene sets were observed to be differentially expressed between Gd+ and Gd– tissues. A detailed list of the gene sets is found in Tables 1 and 2, and Supplemental Table 3

