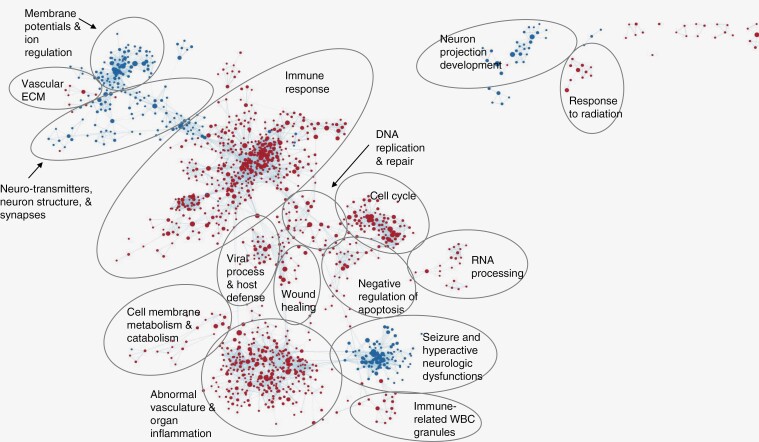
Figure 2.
Fe MRI phenotype is associated with numerous immune biological processes. in these cytoscape maps, each dot is a node comprised of at least 1 gene set, each line connecting the nodes is called an edge and denotes interrelatedness. Red nodes are gene sets that are positively correlated, and blue nodes are gene sets that are negatively correlated with the Fe+ feature. Numerous gene signatures are observed to be interrelated with immune response and abnormal vasculature, regulation of apoptosis, and inflammation being the largest biological processes found to be positively associated with the Fe MRI phenotype.

