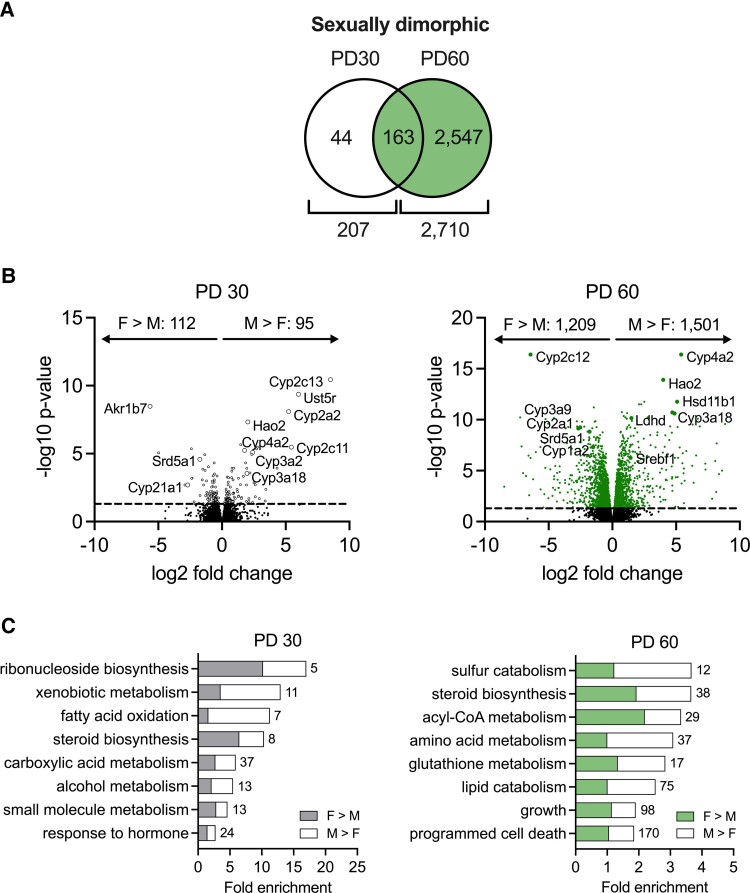
Figure 4.
Sexual dimorphism of the liver transcriptome. A, Venn diagrams show the number of differentially expressed genes between wild-type males (M) and females (F) at PD30 and PD60. B, Volcano plots show the sex-dependent genes and their relative expression at PD30 and PD60. C, Gene ontology analysis revealed sexually dimorphic biological processes at each age. Numbers of DEGs belonging to each biological process are indicated. N = 4 per group. PD = postnatal day.

