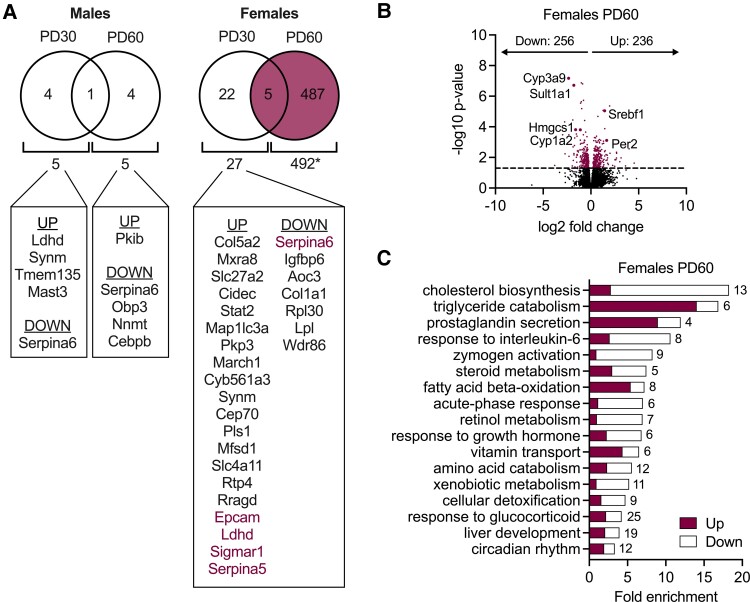
Figure 5.
Sex- and age-selective effect of CBG on the liver transcriptome. A, Venn diagrams show the number of differentially expressed genes between wild-type and CBG-knockout rats in males and females at PD30 and PD60. Genes that were up- and downregulated in CBG-knockout rats compared to wild-type are listed. Genes in purple font indicate that they were differentially expressed at both PD30 and PD60. B, Volcano plot showing CBG-dependent genes in adult females (492 genes). Approximately half of these CBG-dependent genes were downregulated in females lacking CBG, and the remaining were upregulated (adjusted P value < .05). C, Gene ontology analysis revealed CBG-dependent biological processes in adult females. Numbers of DEGs belonging to each biological process are indicated. N = 4 per group. PD = postnatal day.

