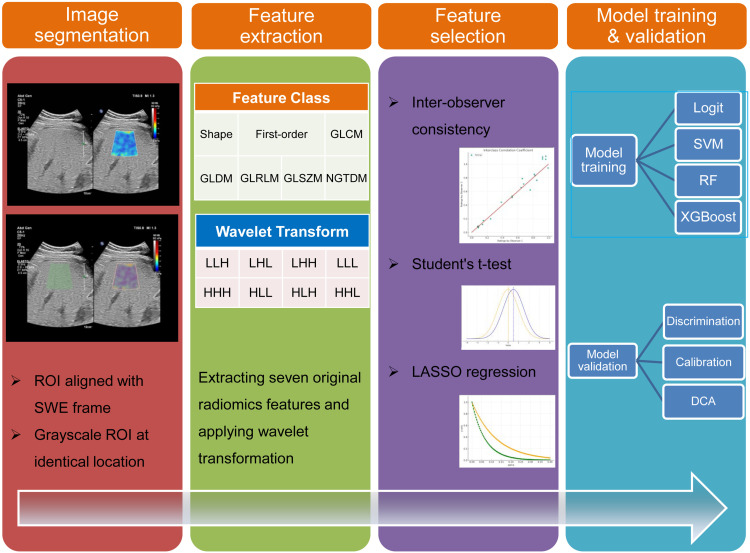
Figure 1.
Workflow Diagram for ML Model Development with Liver Radiomics from Duplex Ultrasound. The process begins with image segmentation and radiomics analysis, leading to the establishment and validation of the ML model. In wavelet transformation, “L” represents low-frequency coefficients, while “H” signifies high-frequency coefficients.

