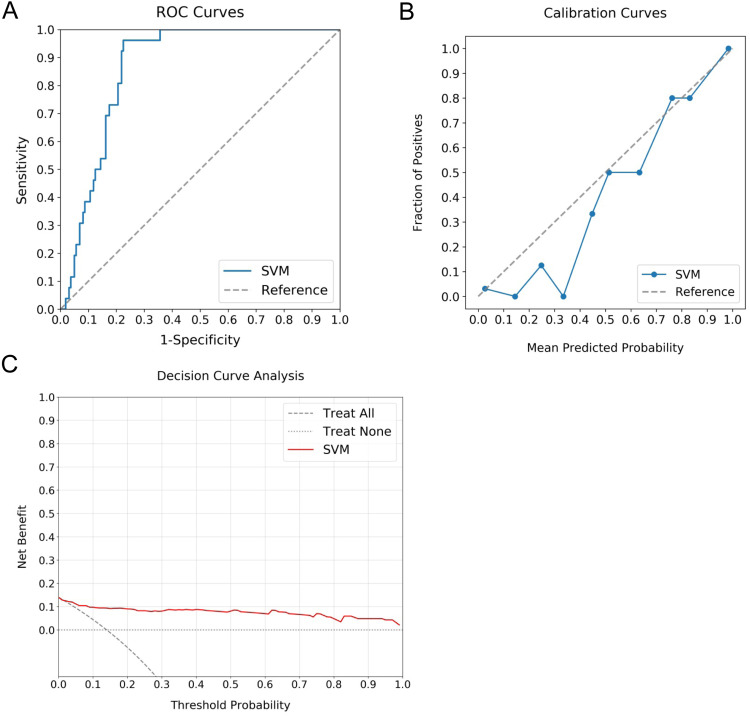
Figure 4.
Evaluating Predictive Performance of Optimal ML Model with External Verification Cohort. (A) exhibits the ROC curve with an AUC of 0.87, indicating the significant discriminative capacity of the model. (B) reveals the calibration curve, demonstrating a robust agreement between predicted probabilities and actual observed events, particularly for predictions beyond a 50% threshold. (C) illustrates the DCA, emphasizing the net clinical benefit provided by the model across the entire spectrum of prediction probabilities.

