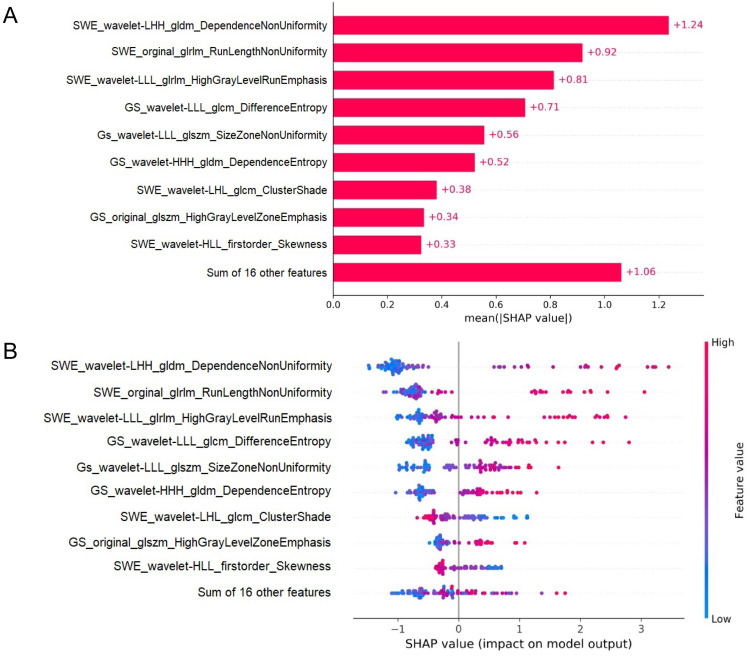
Figure 5.
SHAP Analysis of the SVM Model for Hepatic Fibrosis Prediction. (A) illustrates the ranking of feature significance as determined by absolute mean SHAP values, with three radiomics features from SWE and two from GS identified as the top five critical determinants. (B) presents a summary plot incorporating SHAP values, providing a comprehensive visualization of the cumulative influence of each feature. This graphical depiction indicates a correlation between higher values of the top five features and an increased risk of hepatic fibrosis.

