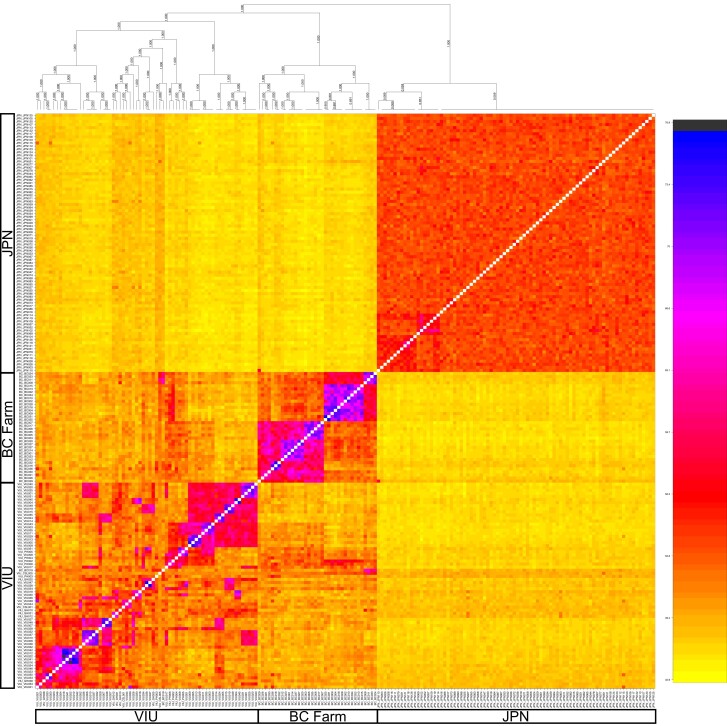
Fig. 3.
Similarity between pairs of individuals based on shared microhaplotypes. Unsupervised clustering positioned all samples within their respective groupings (i.e. VIU, BC farm, and JPN) except for 1 BC farm sample that clustered within the VIU grouping (BC019). The proportion of shared microhaplotypes are shown by the color scale bar, where blue/black (darkest colour) is the highest level of shared microhaplotypes and yellow (lightest colour) is the lowest. The dendrogram (top) shows groupings of individuals based on genetic similarity, with clusters of individuals observed within breeding program groupings.

