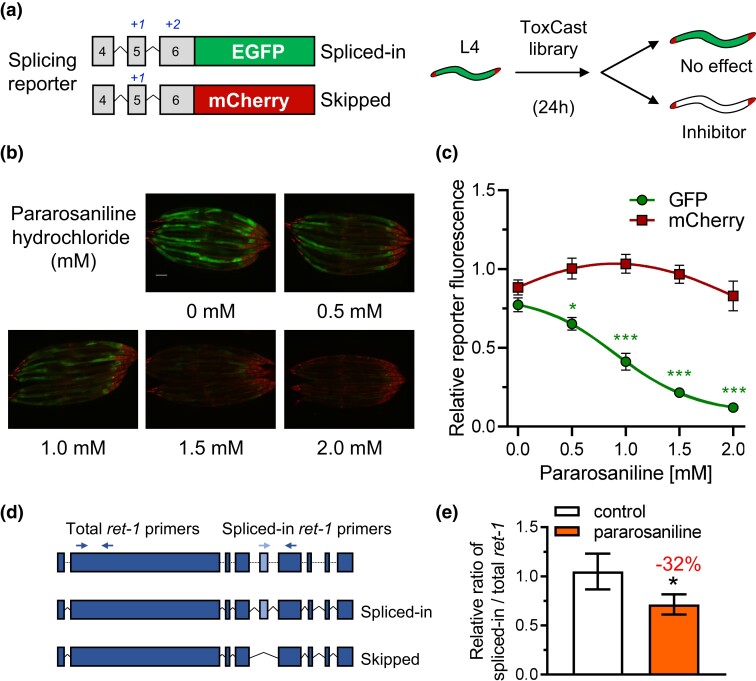
Fig. 1.
Identification of pararosaniline as a modifier of RNA splicing. a) Schematic of the in vivo RNA splicing reporter and the chemical screen workflow. b) Representative fluorescent images and c) relative GFP and mCherry fluorescence of the splicing reporter worm strain exposed to 0–2 mM of pararosaniline on solid media. The scale bar is 100 µm. The data point in c) indicates mean ± SEM of n = 9 groups of 8 worms/group. d) qPCR primer design and e) relative expression level of total and spliced-in ret-1 endogenous transcript in N2 worms under control or exposure to 1 mM of pararosaniline on solid media. The bar graph indicates mean ± SD of n = 4 groups of ∼300–500 worms/group per condition. *P < 0.05, **P < 0.01, and ***P < 0.001 as determined by 1-way ANOVA in c) and student's t-test in e).

