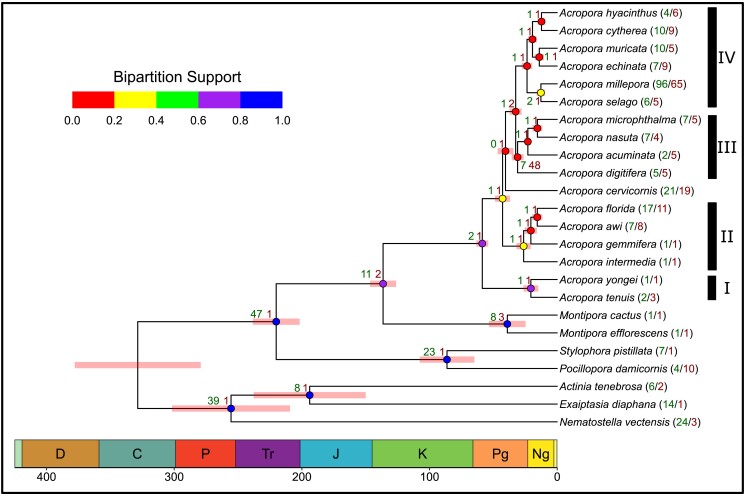
Fig. 3.
Species phylogeny based on identified orthogroups. Node color indicates the proportion of single-locus gene trees supporting each bipartition (i.e. gene concordance factor, a more stringent metric of node support than bootstrap support, Emms and Kelly 2018; Minh et al. 2020). Red bars at each node indicate the 95% confidence interval of the estimated time of divergence marked in geologic periods on the x axis. Green/red node numbers indicate the number of KEGG orthologs which significantly expanded/contracted at each divergence point. Clade groupings from Shizato et al. (2021).

