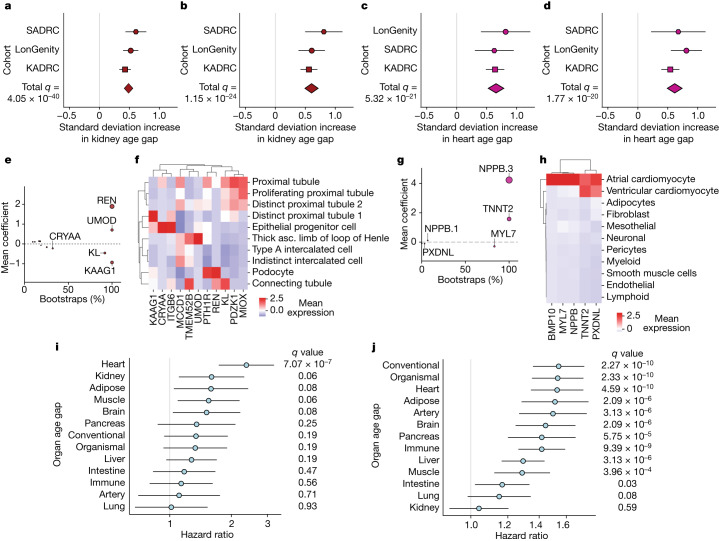
Fig. 2. Organ age predicts health and disease.
a, A cross-cohort meta-analysis of the association (linear regression) between the kidney age gap and hypertension (with hypertension n = 1,566, without n = 1,561). False discovery rate (FDR) P valuemeta = 4.05 × 10−40, effect sizemeta = 0.486. (Supplementary Table 10). b, As in a, kidney age gap versus diabetes (with diabetes n = 335, without n = 2,839). FDR P valuemeta = 1.15 × 10⁻²⁴, effect sizemeta = 0.604. c, As in a, heart age gap versus atrial fibrillation or pacemaker (with atrial fibrillation n = 239, without n = 2,936). FDR P valuemeta = 5.32 × 10⁻²¹, effect sizemeta = 0.657. d, As in a, but for heart age gap versus heart attack (with heart attack history n = 280, without n = 2,904). FDR P valuemeta = 1.77 × 10⁻²⁰, effect sizemeta = 0.615. e, All kidney aging model coefficients. x axis shows % of model instances in the bagged ensemble that include the protein. Size of bubbles is scaled by the absolute value of the mean model weight across model instances (absolute value of y axis) (Supplementary Table 7). f, Single-cell RNA expression of kidney51 aging model proteins. Mean normalized expression values shown. g, As in e, but for the heart aging model. h, Human heart single-cell RNA expression of heart52. Mean normalized expression values shown. i, Cox proportional hazard regression analysis of the relationship between organ age gap and future congestive heart failure risk over 15 years of follow-up in the LonGenity cohort for those without heart failure history at baseline (n = 26 events in 812 individuals). FDR P valueHeart = 7.07 × 10⁻⁷, hazard ratioHeart = 2.37. (Supplementary Table 11). j, Cox proportional hazard regression analysis of the relationship between organ age gap and future mortality risk, over 15 years of follow-up in the LonGenity cohort (n = 173 events in 864 individuals). FDR P valueConventional = 2.27 × 10⁻¹⁰, hazard ratioConventional = 1.54. (Supplementary Table 12). All error bars represent 95% confidence intervals.

