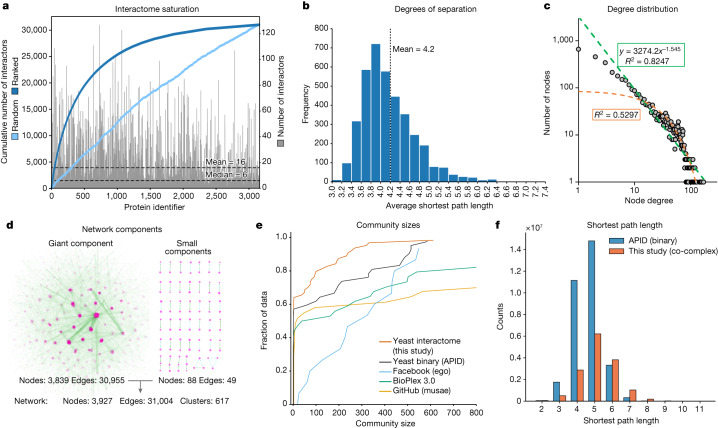
Fig. 3. Properties of the protein interaction network.
a, Distribution of the number of interactors. The sorted cumulative number of interactions reaches saturation at 30,000 interactions. b, The distribution of average shortest path length between all possible pairs of nodes within the giant component shows a mean of 4.2 steps, corresponding to 3.2 intermediaries (degrees of separation). c, Power law fit (green; equals a linear fit on a log–log scale) of the frequency of proteins with a given number of interactions highlights the scale-free properties of the network. An exponential fit is depicted in orange. d, Nearly all nodes of the network are connected with each other in the giant component. e, The cumulative distribution function of the community sizes (Louvain algorithm) detects more smaller communities for S. cerevisiae compared with other interactome datasets. f, Comparison of the yeast co-complex interactome (this study) to a curated yeast binary network (APID database15), showing the distribution of shortest path lengths.

