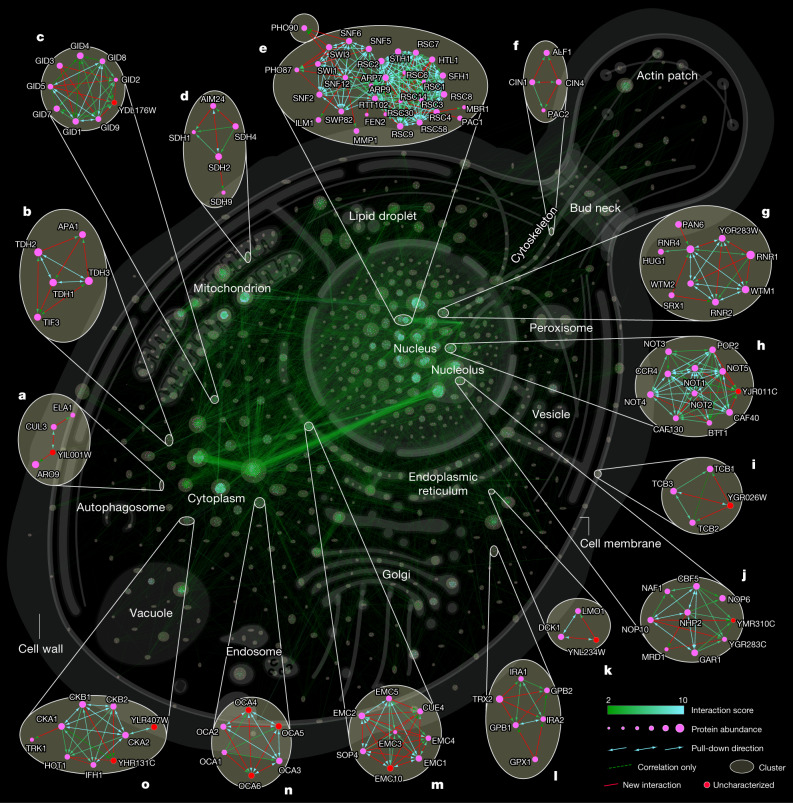
Fig. 4. Network of an in-depth interactome, highlighting novel interactions.
Cellular interaction map of all significant interactions. Clusters are highlighted by circles and cellular localization is indicated by most frequent gene ontology term (cellular component) within a cluster. a–o, Enlargements show examples of either novel interactions (based on BioGRID13) or those that have not been described further as potential high-significance interactors and interactions involving uncharacterized proteins. A full browsable and interactive (Cytoscape56) version of this network is available at www.yeast-interactome.org.

