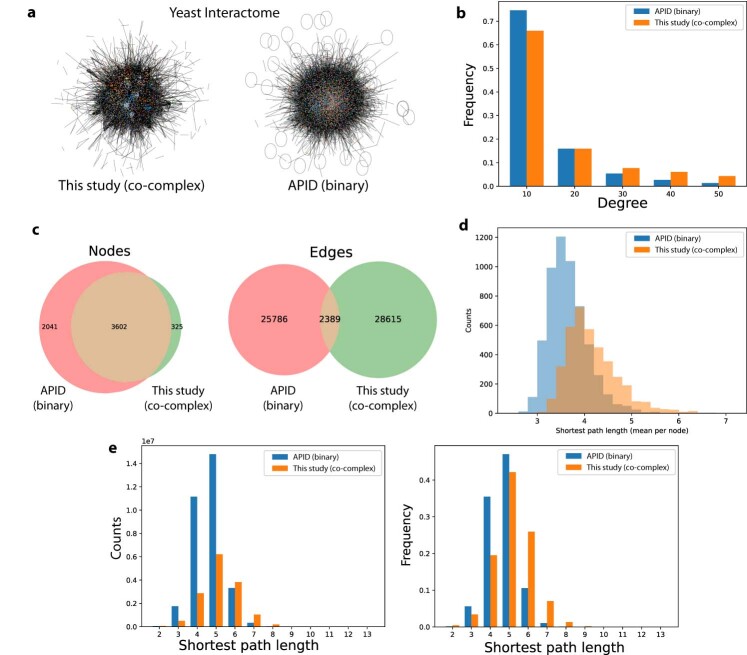
Extended Data Fig. 3. Comparison of affinity-enrichment purification coupled to mass-spectrometry (AE-MS) network (co-complex, this study) to curated binary network (from APID database).
a, Edge weighted network (score and publication count, respectively) using spring-layout. Colors representing different Markov clusters. (Fruchterman-Reingold algorithm). b, Frequency of degree (number of interactors) of both datasets. c, Overlap of nodes and edges between both datasets. d,e, Distribution of shortest path length (mean per node and all).

